What is Changing With Loupe 5?
Loupe 5 represents a massive change for the Loupe ecosystem and is coming out for our Loupe Cloud-Hosted users very soon. If you haven’t followed our coverage leading up to this release, here’s a quick look at some of the major features of this new version.
Efficiency Focused Split-Screen Interface
The most significant change with Loupe 5 is a brand new User Interface. For example, take a look at our demo of Loupe View:
The split-screen interface allows me to seamlessly jump from one application session to another and dig into log data, events, and more without losing my place in the broader dataset.
This UI takes full advantage of modern computing hardware while still being capable of compacting enough to work on a standard tablet. You can get more of a look at the Loupe 5 UI in this blog.
Insightful Metric Data Made Easy
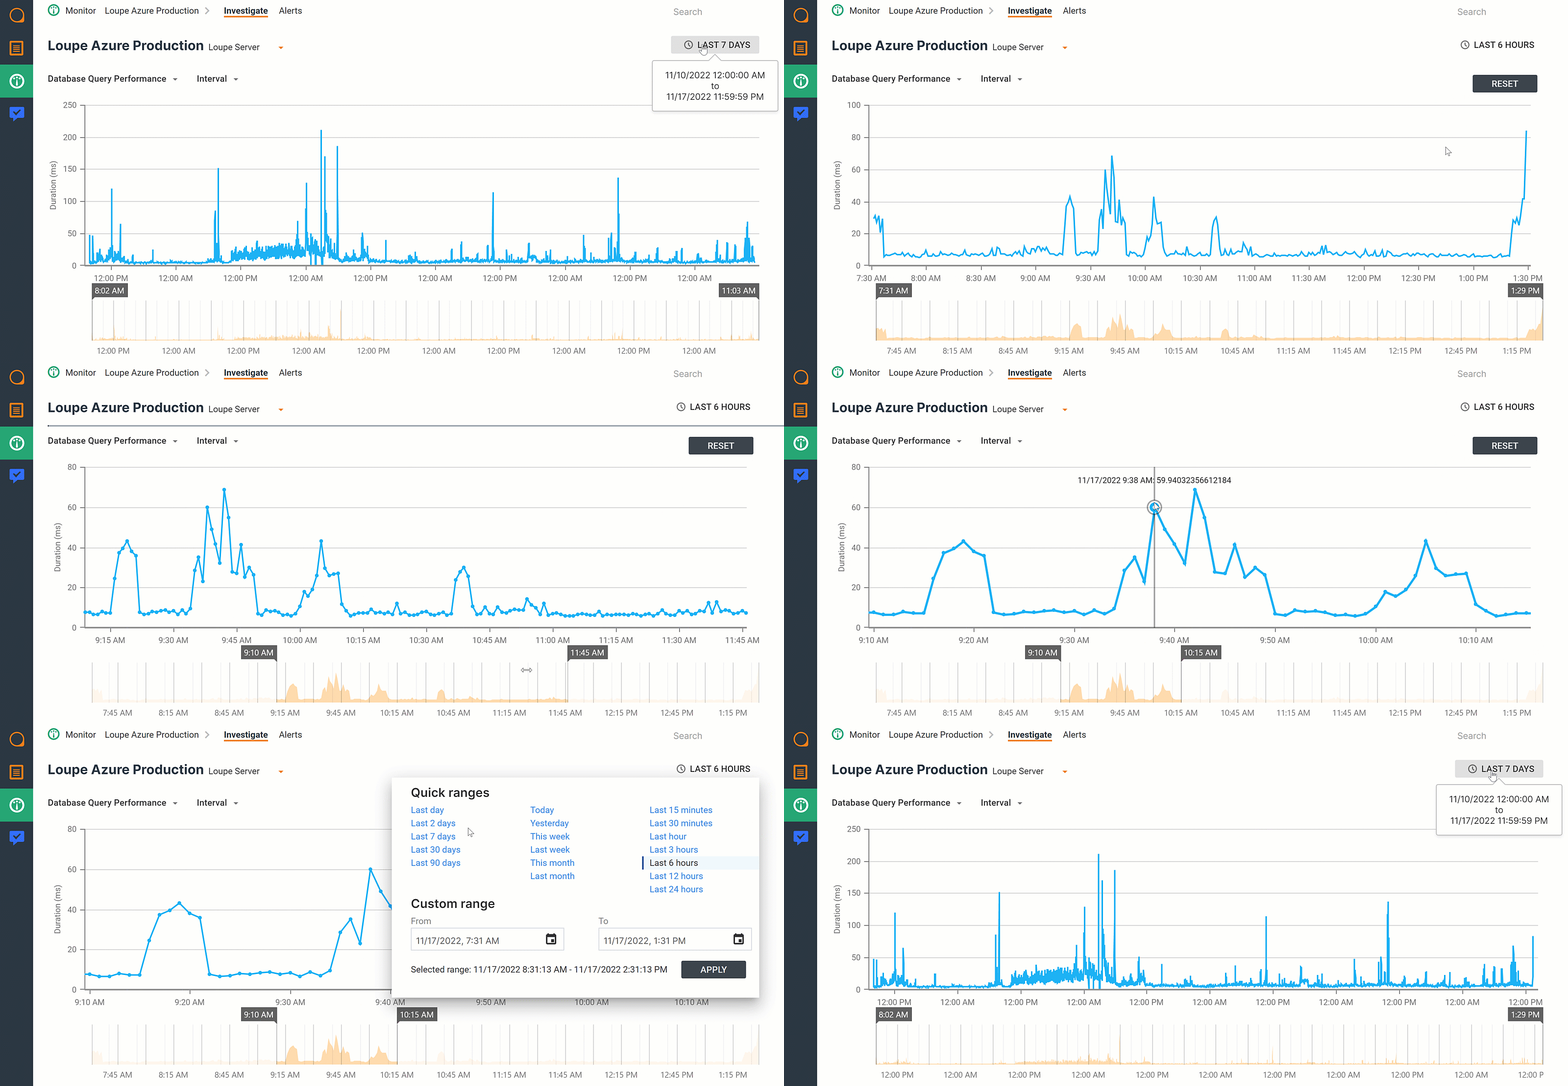
Loupe Desktop has let users collect and graph metric data from their application for a long time. With Loupe 5, we’ve streamlined those capabilities and taken them to the cloud. Let’s take a look at the Loupe graphing interface showing database Query Performance Over Time:

Loupe 5 introduces new ways to view metric data already collected by your logs. Investigate Database Query Times, Error Rates, Processor Time, Page Hits, and more using intuitive data lists and visual graphs.
Our Metric data graphs can display a week’s worth of data or just the last few minutes. Use these ranges to both view performance trends over time or inspect behavior minute-to-minute.
A New APM Leveraging Your Existing Log Data
Loupe has traditionally focused on the development team - providing feedback on what issues to address, details on who’s using the application, versions used, and other insights. But with Loupe 5, we’re expanding our scope to include the operations team with a new APM Module: Loupe Monitor.
Our APM uses the same integration as the rest of Loupe to leverage the application data that Loupe already gathers, but instead of focusing on application defects, Loupe Monitor tracks operational errors—anything that prevents the application from delivering on what it’s intended to do. This way, operations teams can monitor their critical applications and quickly respond to problems independently from the rest of the organization.
For a deeper look at Loupe Monitor, you can read our announcement or take a look at the Loupe Monitor product page.
Where Can I Learn More About Loupe 5?
If you have any questions about the Loupe 5 Rollout, take a look at our dedicated FAQ. If you would like to see some more of Loupe 5, the following blogs are about Loupe 5 or contain example usage:
- A Look at the Loupe 5 UI
- Introducing Loupe Monitor: Our APM Solution
- Centralized Log Viewing in Loupe 5: What’s Changing?
- I’ve Been Using Loupe 5 for a Month. What is it like?
- What’s Coming in Loupe 5
- What Data Should You Include in a Log?
- What Does it Take to Log with Loupe on .NET 7?
If you don’t use Loupe currently (or want to try out a fully enhanced version with every module), you can learn more about our free trial in the link below.