Introducing Loupe Monitor: Our APM Solution
Loupe has traditionally focused on the development team - providing them feedback on what issues to address, details on who’s using the application, versions used, and other insights. But for the upcoming Loupe 5, we’re expanding our scope to include the operations team with a new APM: Loupe Monitor.
Our APM uses the same integration as the rest of Loupe to leverage the application data that Loupe already gathers, but instead of focusing on application defects, Loupe Monitor tracks operational errors—anything that prevents the application from delivering on what it’s intended to do. This way, operations teams can monitor their critical applications and quickly respond to problems independently from the rest of the organization.
Alerts Instead of Issues: How Loupe’s Leveraged for Application Monitoring
Take a straightforward web application running in your production environment. When an error is recorded, it should be triaged to determine whether it’s an application defect (like a null reference exception) or an operational error (like being unable to contact a database).
We have already built high-grade tooling for application defect tracking with the version-aware Loupe Resolve. Loupe Resolve allows you to track which updates introduced a bug, when you fixed it, and whether it returns using the Issue item.
Operational errors are different though.
Operational errors are generally fixed by changing some aspect of the application’s deployment rather than through software updates.
Because of that, information like whether the error happened three versions ago is not valuable data for solving these problems. Therefore, in Monitor, we built a new item to simplify operational error tracking: the Alert.
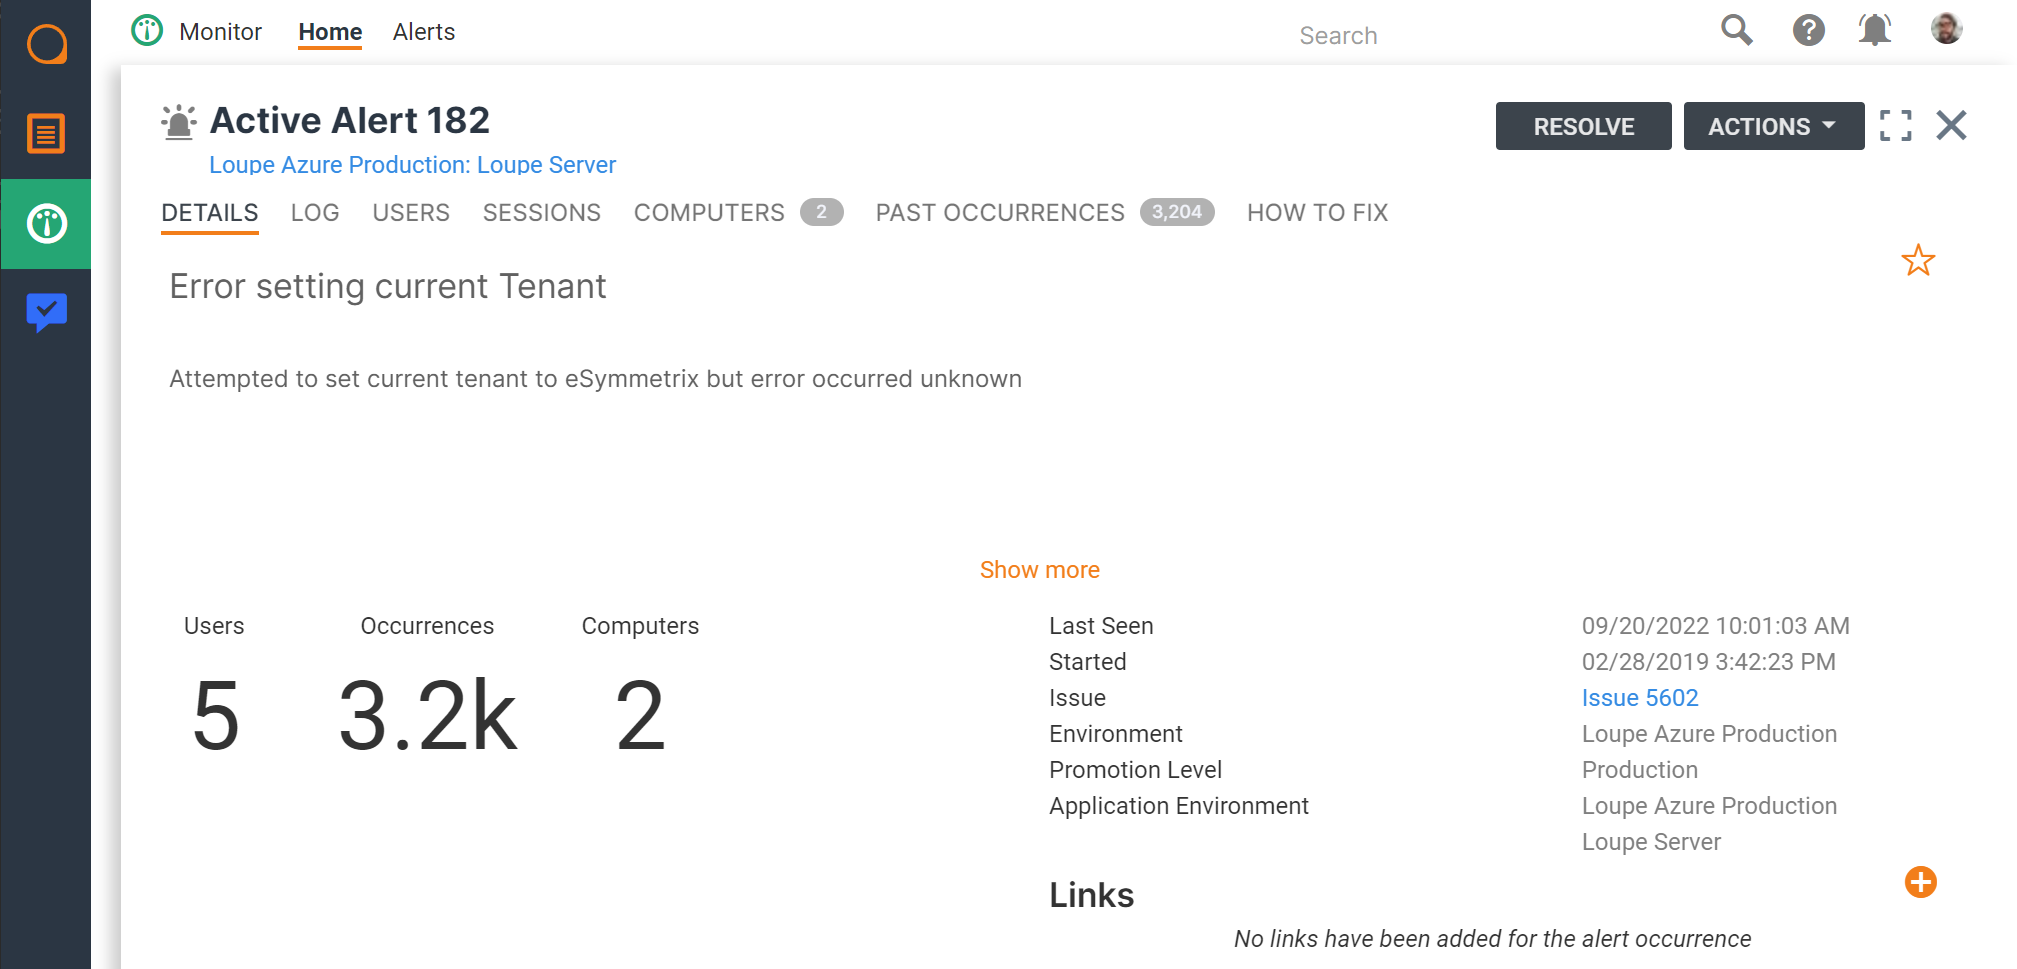
Alerts are essentially quick references to operational problems. An alert presents the important info front and center:
- The error message and a severity indicator as the header of the alert
- The number of users affected by the error
- The number of Sessions in which the error occurred
- The number of computers on which the error occurred
- The date and time of the first and most recent occurrence of the error
Below the fold is error information, the full exception, and any notes taken.
This information allows you to effectively prioritize each Alert. An error that affects one user differs in severity from one that affects thousands—the first of these errors may need fixing this week, but the other probably needs immediate attention! Depending on your deployment, the same idea may also apply to sessions and computers, so it makes sense to prioritize these data points above anything else for application monitoring.
Alerts do include some historical information—such as past occurrences of the error—and a place to write notes for potential fixes and workarounds, but the primary purpose of an Alert is to notify the operations team of a potential problem and provide the information needed for a swift resolution. If an error is just noise, you can suppress the Alert and move on.
How Loupe Monitor Organizes Your Data
Organizing the data for Loupe Monitor requires a different approach than our other modules. Our other tools care more about the application version, but application monitoring is all about where the application lives.
Operational errors often apply to just one environment. For example, the production database server is usually isolated from the staging database, so a connection failure in one doesn’t mean there’s a problem in the other. Additionally, a problem in your staging database will be prioritized differently than one in your production database. Lumping all that data together makes little sense, so with Loupe Monitor, we organize the data by the environment.
In Loupe Monitor, an Application Environment is a single instance of an application you want to monitor. Once an Application Environment is created, you can modify it to meet your monitoring needs.
What if my application relies on multiple services?
Often, an application’s deployment is not just a single service—it may rely on other applications in the environment or use a microservices architecture.
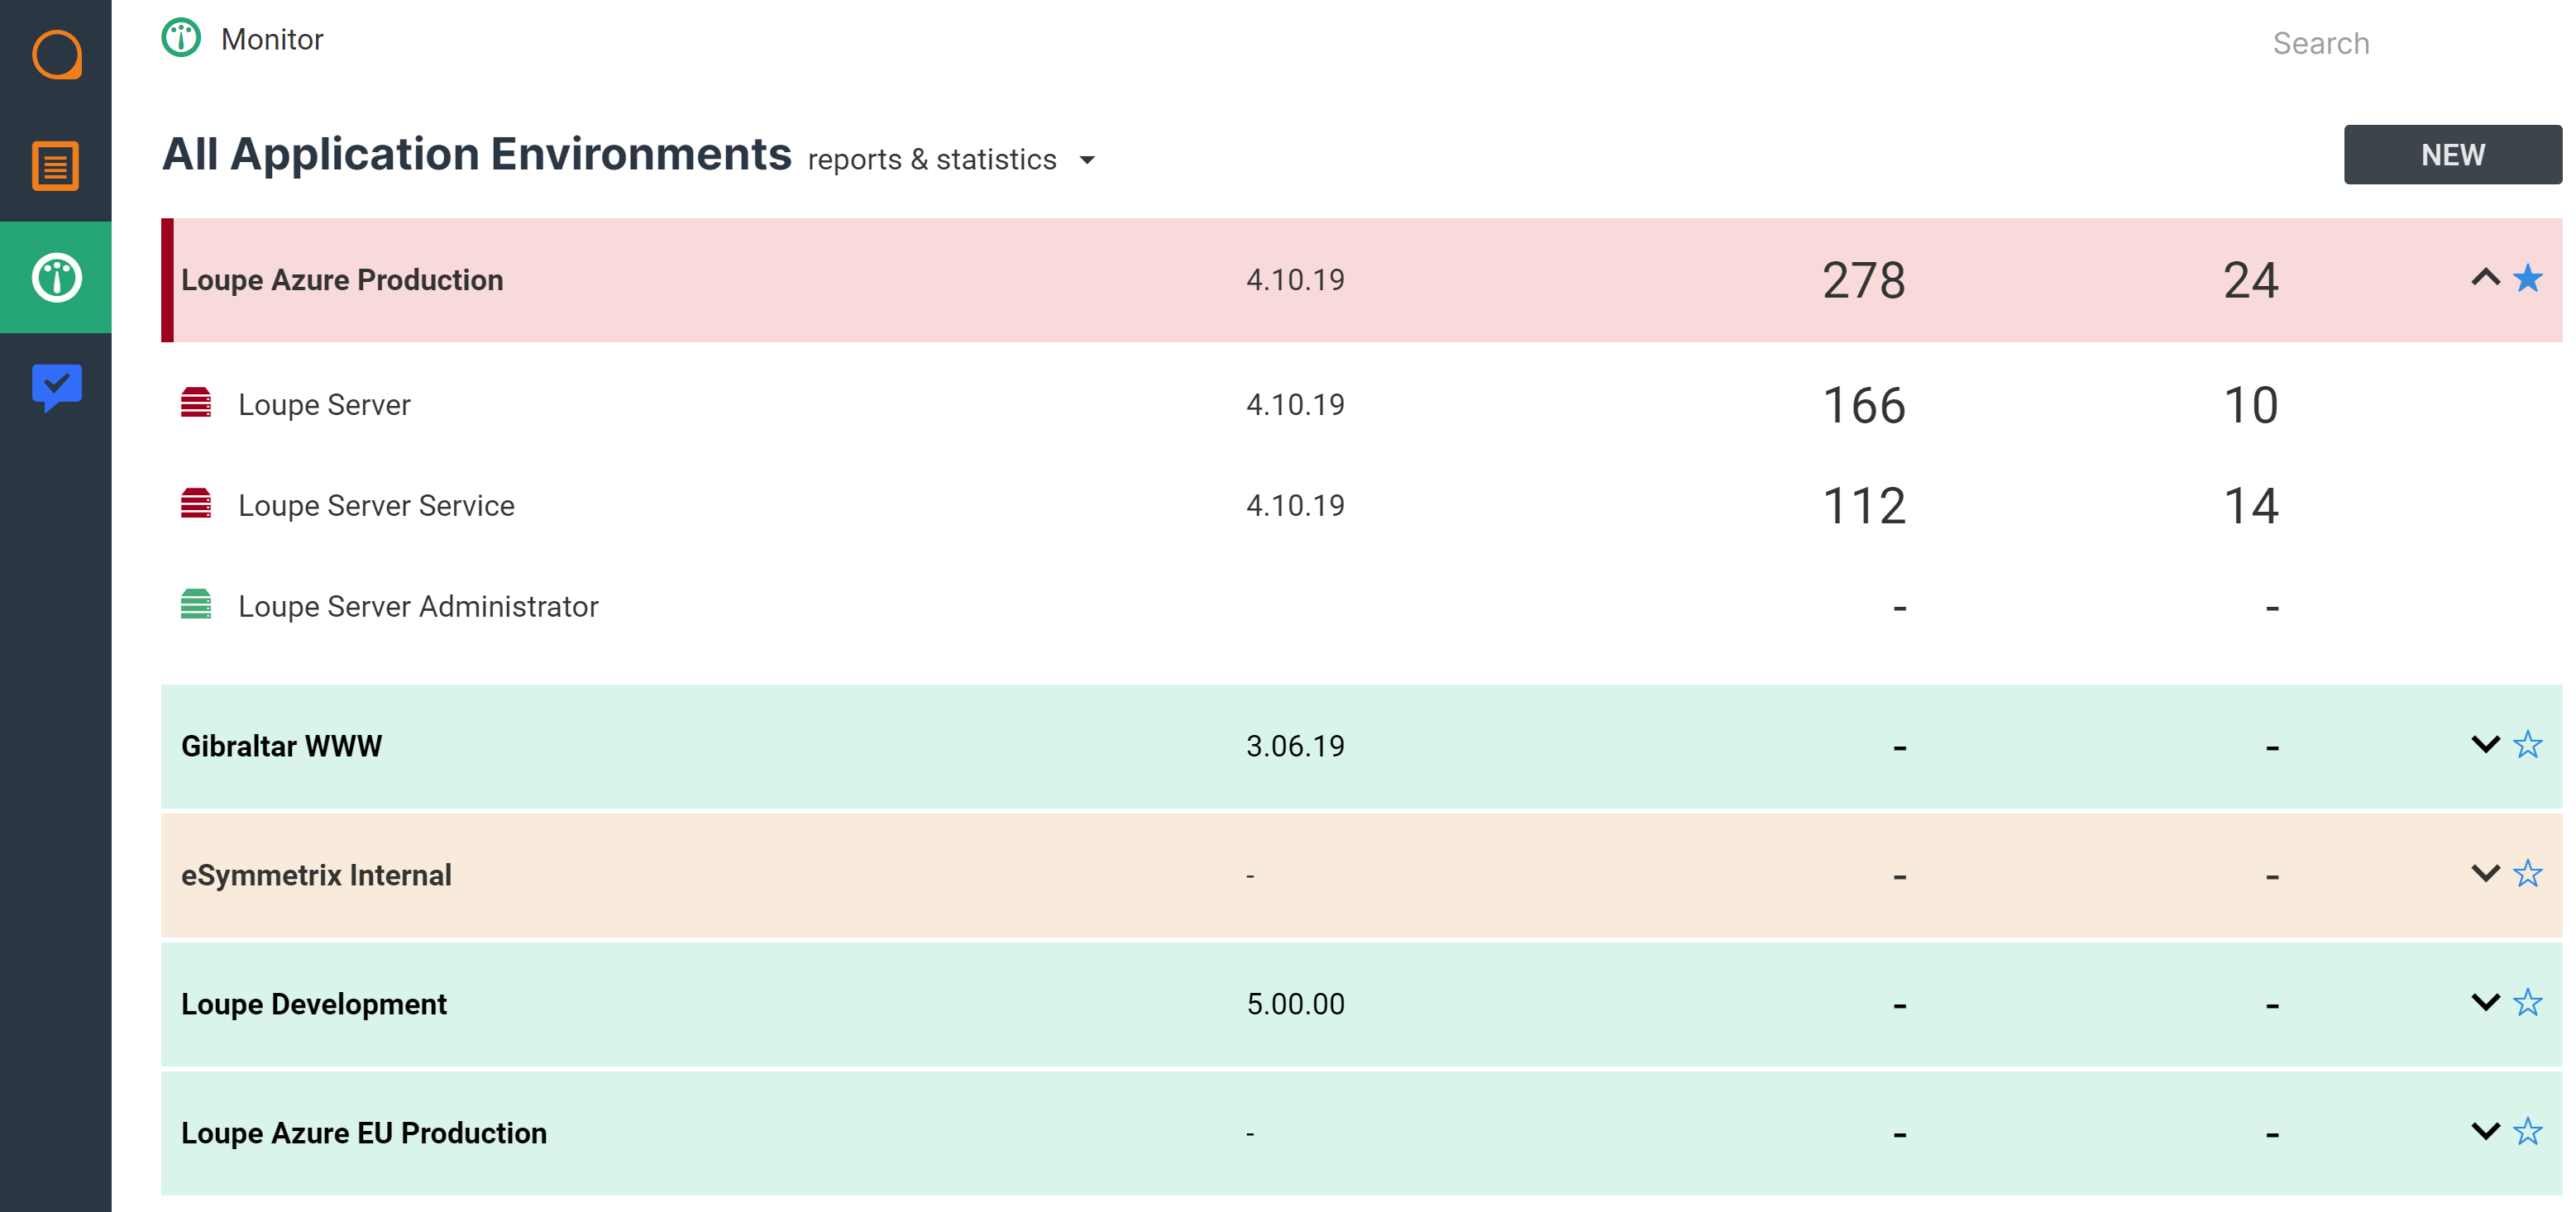
With Monitor, you can further break down each Application Environment into its distinct components. For example, the screenshot above shows our Monitor repository for Gibraltar Software. The Loupe Azure Production Environment contains three components we want to track. Luckily, each one tracks its own alerts, performance metrics, and log history, which you can access on their individual “investigate” pages:
The GIF above shows a portion of Monitor’s “Investigate” page, cycling through two graphs showing log message rates and database query performance times. These metrics are tracked for each component individually to simplify troubleshooting, and each piece has a separate log feed for the same reasons.
How does Loupe handle data for complex deployments?
With Loupe, an Application Environment does not need to correspond to specific hardware.
An Application Environment can cover an application running on a single server or across multiple instances, like an auto-scaling cloud service. This helps when a client moves back and forth between instances when you would want the data grouped together anyway. But each log has the machine information as well, so you can still identify and dig into problems that are instance-specific.
Overall, Loupe Monitor’s Application Environment organization structure allows you to be as broad or specific with your data as you need. For example, Loupe Monitor can show summary information of metrics and log data for the whole Application Environment and each service it contains, letting you see load and resource utilization within the various nodes of each service. Similarly, you can follow a single user or transaction across the entire Application Environment or within just one service to facilitate real-time troubleshooting.
Coming in Loupe 5
The Monitor module will debut in Loupe 5. It will be included in all Loupe Self-Hosted Licenses and part of Loupe Professional onwards for our SaaS users. Once you have upgraded to Loupe 5, you can configure Application Environments and give our new APM a spin for yourself!
Loupe 5 is coming out soon, and we have much more to show you. Stay informed about what is coming in Monitor and the rest of Loupe 5 by joining our email list with the form below.