What Data Should You Include in a Log? It Depends.
We have written a lot about logging on this website. That content includes fundamental material, such as what you should be logging in your application (I reference this post about once a week), or how to log to a file with Microsoft.Extensions.Logging. But I don’t think we’ve discussed one portion of logging as much as we could: adding supplemental data.
Knowing how to set up a logger and what to log is helpful, but it doesn’t magically make your logging perfect. Despite attempting to write decent logs for most of my career, I didn’t know everything a log could include or how to create effective, data-rich logs until I started working with Loupe. Frankly, I found most of my logging hard to use and unhelpful.
That doesn’t need to be the case for you though. Creating effective logs requires knowing the data that’s important to add and how to best present it. Here, we will look at some real logs, their data, and discuss how the log sink can affect the data requirements for effective logging. Hopefully, by the end, you will have some ideas on how to take your logging to the next level, how the log sink affects the data you desire, and how the log sink effects using the data.
What Supplemental Data Can I Find in Logs?
We will look over supplemental data added to some real logs, and discuss why it was added. But let’s start with what’s considered required:
- The Log Message. The message is the main point of the log. This is the piece of information important enough to bother recording. It can be an error, an announcement of a process starting, or any items listed here. But it’s the body of the log. Not having it would be like a sandwich with no bread (or no tortilla, if that’s your style).
- The Log Severity. Is this a critical error, warning, or information log? Including the log severity allows the reader to prioritize messages and filter out currently distracting logs (note that logs considered “Verbose” severity may not have a clear indicator but still possess a severity level).
Most logs you write should include more data than these two points though. Let’s look at some examples. They’re pretty simple logs, for the sake of getting a decent screenshot, and not necessarily examples you want to replicate. Many of these logs are flawed or dependent on context, but appropriate for a conversation.
Visual Studio Default Microsoft.Extensions.Logging Log
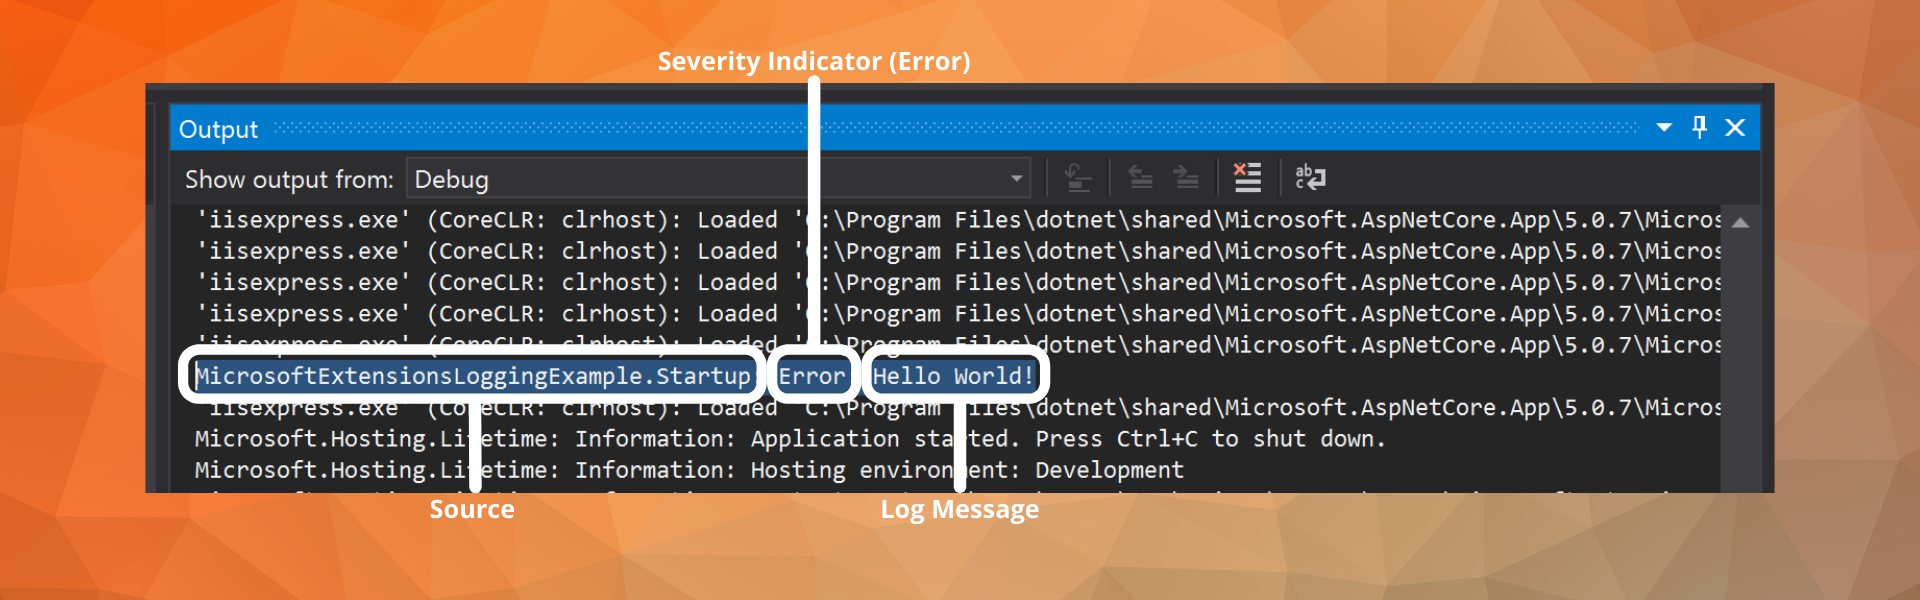
This log is taken from another post on this blog, “Where Does Microsoft Extensions Logging Log To?”, showing a simple message in the Visual Studio debug console. It only contains three pieces of data:
- Severity Indicator. Very basic, just written out. Some surrounding logs have a severity of “Verbose” resulting in no indicator. I would filter these out in a real development scenario as they are often unhelpful.
- Log Message. “Hello World!”
- Source. This console displays IIS and my .NET application logs, so the source is crucial for distinguishing messages between the two.
Google Chrome Console Angular Log
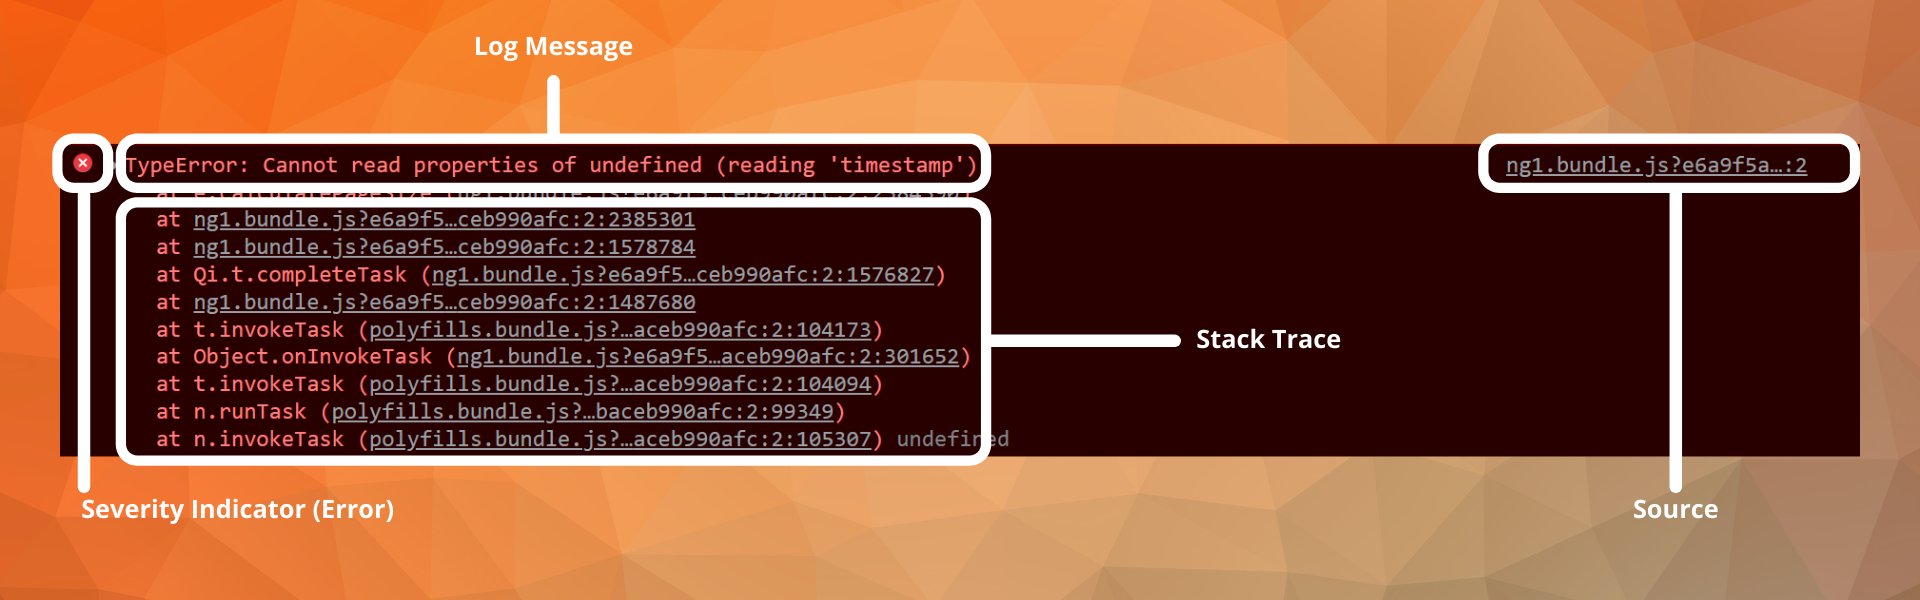
This is a log from the google chrome console I encountered while testing a new feature for the upcoming Loupe 5. It includes four pieces of data:
- Severity Indicator. Simple
Xshape, very common symbology for error level severity. - Log Message. In this case, it’s a
typeerrorfor the ‘timestamp’ variable. - Stack Trace. Shows the path through the application/code taken to get to the error—convenient data for troubleshooting.
- Source. A link to the file which executed the code responsible for the error. Web applications often use resources outside the core application (like JS libraries and CSS), so I often use this to help determine whether the log is my problem.
Serilog Enriched Log File
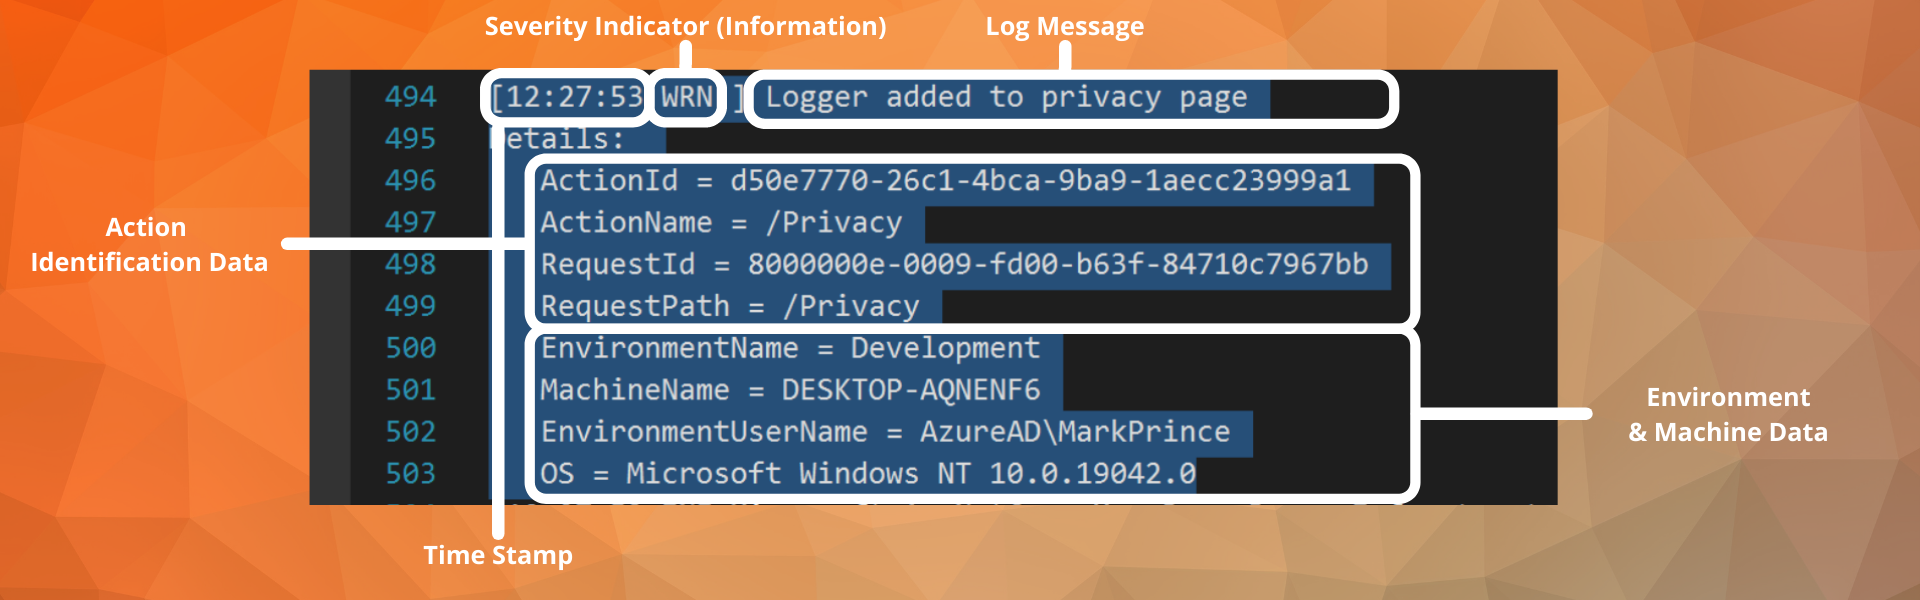
Here’s a log I created while testing out Serilog enrichers. It includes a decent amount of data:
- Severity Indicator. Just “WRN” text. In a console, this could be color coordinated. In your average text editor, that is not the default case.
- Log Message. I wrote a log stating I had added Serilog to the privacy page.
- Timestamp. For any long-term logging (logs intended for use days/months later), a timestamp is essential. Often, you can only read the log after the application runs, not in real-time. In this case, I only used the time because the file name included the date.
- Action Identification Data. This includes data like an Action ID, Request ID, etc. I’m using this term to specify data points designed to identify the process responsible for the log. In this case, it was simple navigation to the privacy page. I prefer the class and method information over a set of ephemeral IDs, but these are helpful once I’m familiar with them. Other logs in this set included Event IDs and a more traditional Source item.
- Environment & Machine Data. This includes data like the OS, user identification, machine name, and environment name.
This log lacks some information I like, such as the stack trace (which you can add). But what I do like about the log is the machine information. Knowing the user, the environment, and OS may provide important context on past events, and help me prioritize work.
For example, if a “power user” runs into a bunch of errors with the most recent update, I will want to fix what I can, and possibly reach out to them with potential workarounds for the near future. On the other hand, if I see errors from our dev environment or on a device with an operating system we no longer support, I can often give those errors a lower priority.
In theory, the data included in this log example is beneficial, and in practice, I value the information in most long-term logs. But this execution is unpleasant:
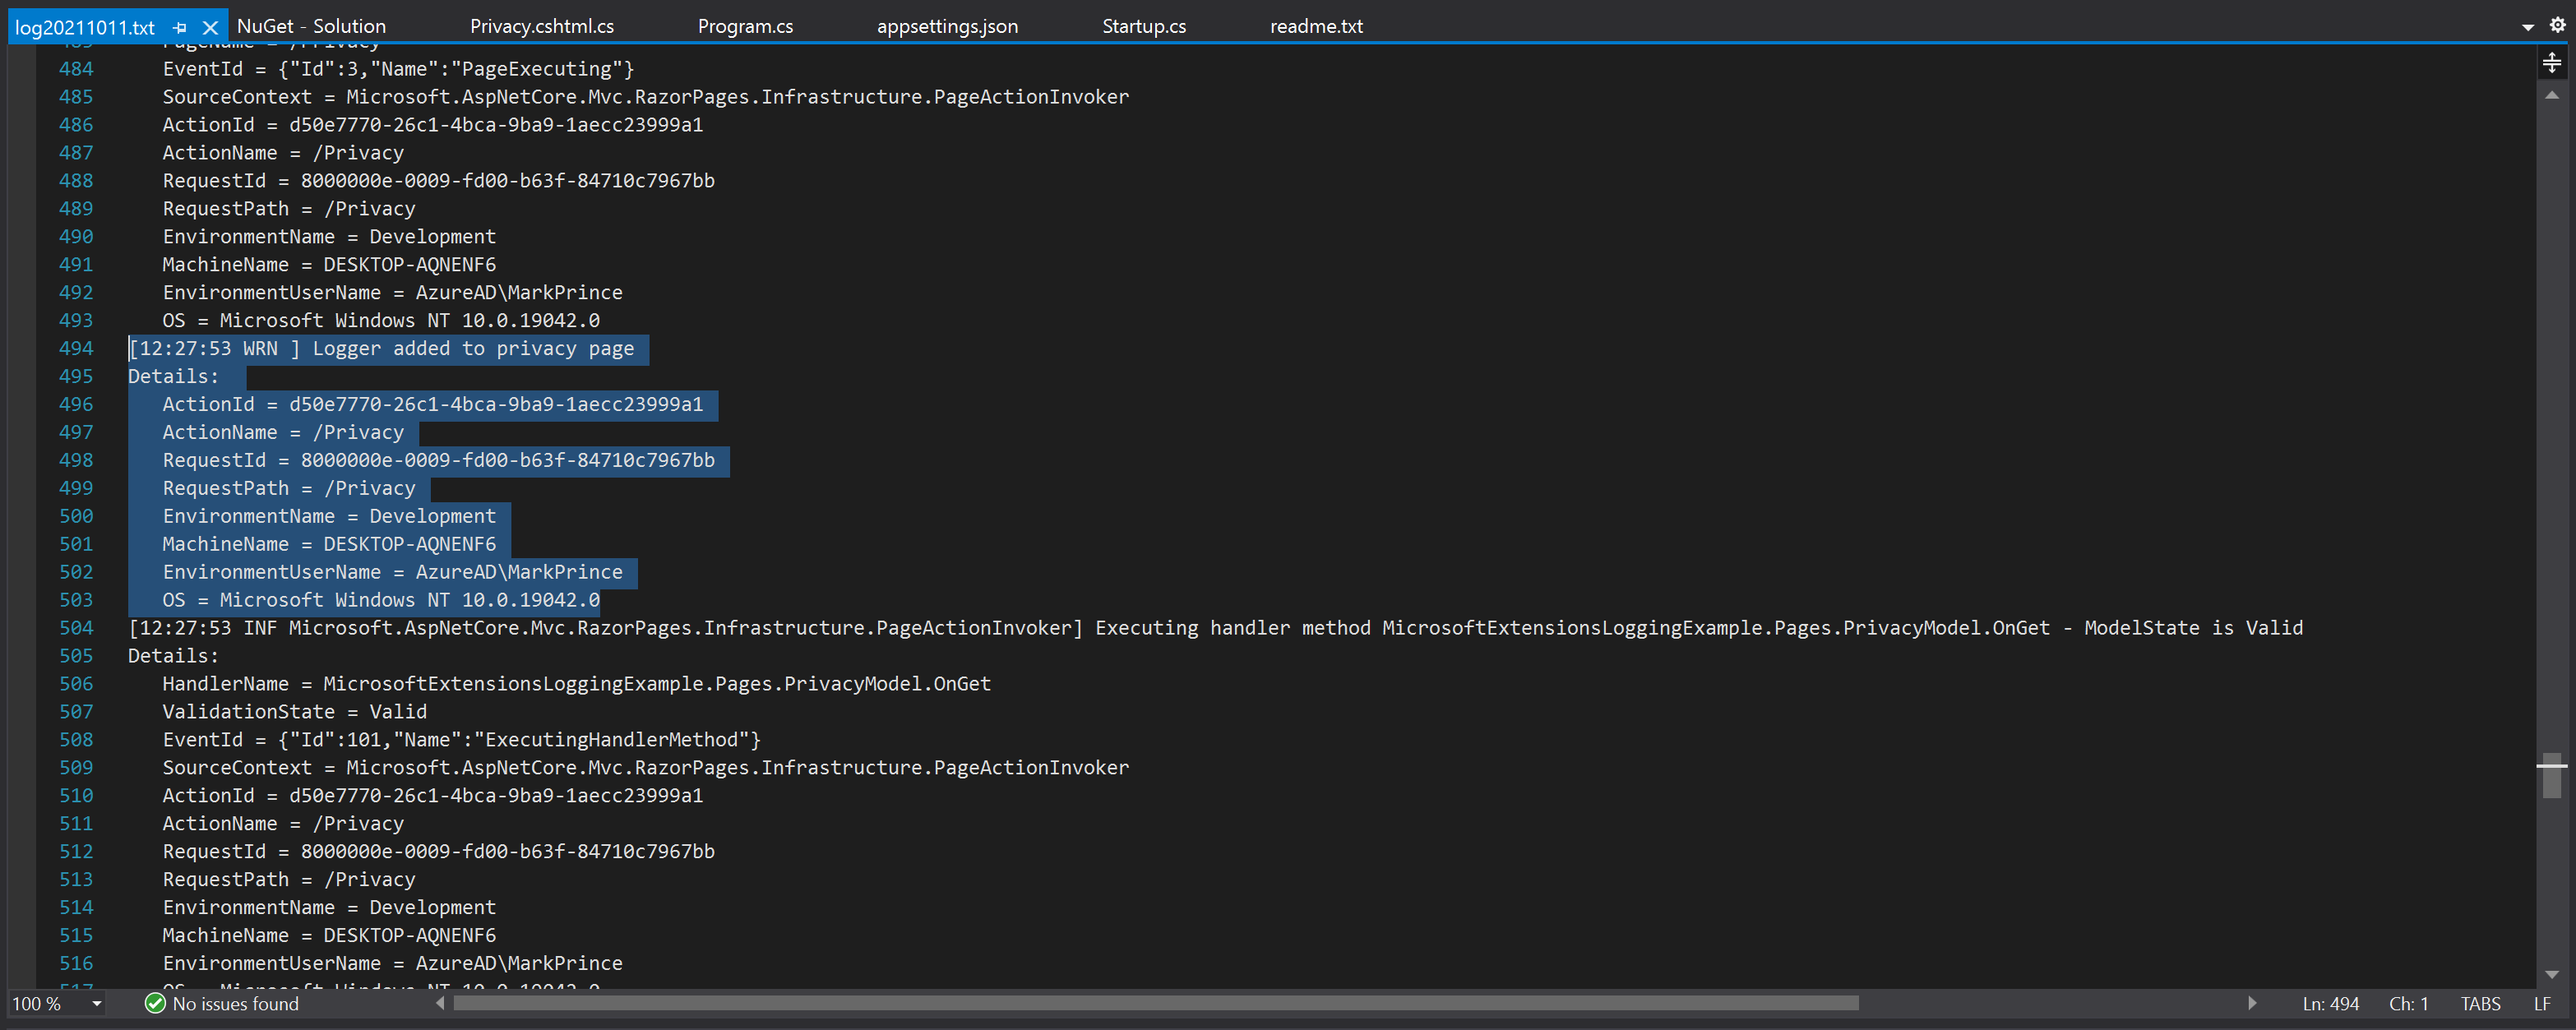
I don’t want the machine and user data attached to every log if they remain consistent throughout the entire file. In this case, I was operating the application in my local dev environment, by myself, so they were very consistent! The same will apply for any desktop/mobile application; the data should remain static for the entire run.
So, is this a problem with including the data, or a problem with my log sink? Well, before answering that question, let’s determine when the data is actually valuable.
How Does the Log Sink Effect the Data You Need?
How I use each sink differs, and the importance of the data varies accordingly. For example, let’s discuss the timestamp.
The timestamp is the first item listed in my Serilog example, but not part of either console log. That’s not a mistake; it’s just not essential data for those logs. They’re designed to be temporary and viewed in real-time. For that context, the timestamp isn’t too important, as the time will generally range from “a few seconds ago” to “right now.”
For the text log though, it’s a critical piece of data. Larger log files may contain multiple days worth of information. Finding relevant logs for a specific hour of one particular day could be very difficult without the timestamp.
The same applies to the ID information included in the text log, where I can use that data to search the logs for specific users/machines after their sessions. I could, in theory, use this data in the console as well. But I generally use the console for active troubleshooting, where I know I’m the user and know the environment.
All this is to say, the target log sink for a log will determine the data I want to include. For real-time temporary logs, like those in the consoles, I just need the message, severity, and appreciate source/class and method data. Any other data is welcome as long as it is easy to read/ignore.
I worry more about what to include in my long-term logs, as that data can be the key to finding the log/context I need later.
So I tend to like more data than less, but let’s get specific.
Throughout working at Gibraltar, this is the data that I have found consistently useful:
- Class and Method. Many errors require code changes to fix, so knowing the method that had the problem is an excellent place to start.
- Stack Trace. I’m happy to know the method called that resulted in an error. I’m happier if I know the methods called before that too.
- Event ID. If a user clicks a button or navigates to a new page, I want to know that. Event IDs can help you identify and later reference these actions.
- Timestamp. I want to know when the problem happened, as I care about what occurred yesterday more than what happened a year ago. Also can help analyze trends over time.
- Platform Diagnostic Information. Depending on the application, this can include data points like the operating system, browser version, computer’s name, framework version, and more. As I have mostly worked with web-based projects, the browser version is an item I’m looking for when researching a unique error.
- Machine Specs. Amount of RAM, processors, storage, viewport, etc. Helpful info for troubleshooting performance issues. Performance issues widespread across high-end and low-end devices are higher priorities than those exclusively on devices below a minimum spec or right on the edge.
- User Information. User ID, potentially name. I don’t want to know their life story, just enough info to sort the logs or follow their session in isolation. Additionally, if I find someone having a real bad time with our application, I sometimes want to reach out. This, of course, depends on your user data agreements and local laws. It’s the information I’m the least comfortable using (I generally hide it during Loupe demos unless displaying my own data). Still, a user ID can go a long way with troubleshooting and helping the user out.
But it’s pretty cumbersome to have all this data attached to the end of every log. I could write my logs so I only get the full rundown for specific events (like application startup), but that’s pretty tedious. Plus, it could be challenging to get right for complex deployment scenarios.
But I don’t need to worry about any of this when I can use a log sink that organizes the data for me.
To Get The Most Out of Your Logs, Use a Better Sink
Maybe I just have an unfair vendetta against Notepad, but I just think a text file is a poor choice for data-rich logs.
They lack readability without heavy modifications and are often hard to search through.
Even the better text editors with multi-file search can be annoying as it can be challenging to narrow down results using multiple terms.
The result for me was a bunch of logs taking up storage that I had trouble using and finding when I needed them.
Long-term logs are at their best when they have plenty of diagnostic and contextual data to fill in the story, but your standard text file is just not good at presenting that data.
The solution is to use a permanent storage sink other than a text editor. Use a dedicated log sink designed to present and organize the data in your logs to make them easily readable. In some cases, they may even collect this data for you, meaning you don’t need to spend the time formatting/specifying the data yourself. It solves two problems:
- Your logs will be easier to read and access.
- Your code will be easier to read, as you can dedicate less space to formatting and collecting every bit of data.
The dedicated log sink I use is Loupe.
That’s not a surprise; I am incredibly biased to do so.
But recently, I haven’t been using our production version. I’m using the internal version of Loupe 5:
There was too much data to display, too segmented to make a chart, so I made a video! It starts on the session details page, where you can view most of the specs and diagnostic information. Then I move to the Log tab, which contains the individual logs with severity, message, exception, timestamp, class, method, and stack trace. The “users” tab would let me view the logs for each user individually, and I can look at performance data in the metrics tab.
Every piece of data has its place, appropriately included with the session data or individual logs.
Loupe even adds some of this data automatically.
I don’t need to tell it to record the methods used or grab the user information, as Loupe’s already designed to do so.
The same applies to metric data if I use the performance counter agent.
Better yet, I can then search through the logs using the multiple data points as filters with ease.
But Loupe 5 is not out yet. Soon! But not yet.
So if I needed to solve the problem today, I would start with the Loupe Desktop client. It’s completely free, forever, and it’s a massive improvement over Notepad. Just add the agent to your application (.NET or JAVA), integrate it with these directions, and run it. Then you should see a local log session and see how Loupe organizes the data.
But if you want to know when Loupe 5 comes out…
Loupe 5 is our ideal logging platform for getting the most out of log data. If you would like to know more about its release, you can sign up for the email list in the form below: