Easily track the real performance of your application for users
No Application is an Island
Gone are the days when your application had a whole computer to itself. Today's systems are expected to do many things at once, whether it's running ten things for a user from Email through YouTube or hosting a dozen web sites or more.
Loupe captures the critical windows performance counters that show the processor, memory, disk and network usage while your application runs. With this data you can determine if your application is slow because of what it's doing, or because of something else going on with the computer.

Find the Connections
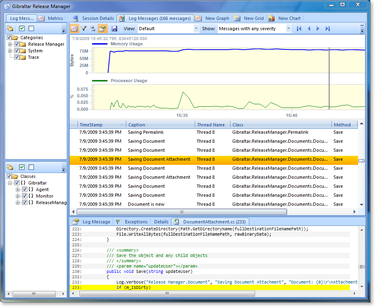
Unlike options that are just a logging system or just a profiler Loupe shows you both sides: The performance metrics and the logging data recorded by your data at the same time, in a time-synchronized view. Just click on the graph at a point of interest and the log will jump to the nearest entry. Loupe will pick commonly useful metrics automatically, but you can create custom charts on the fly with the metrics of your choice.

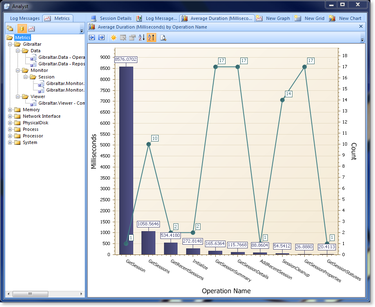
Create your own Performance Monitor
You aren't restricted to the metrics Loupe monitors by default, you can easily create your own. It's a lot less work than you'd think. Loupe metrics are fully thread-safe, designed for high speed use in performance sensitive environments, and cover a wide range of needs.
With custom designed metrics you can get sharp insight into the reasons why your app performs as it does without having to guess based on interpreting generic data captured by the operating system.
You can record more than just how much or how long - you can capture the characteristics of what your software is doing to understand why some searches are fast and others are slow or your performance falls off at 60,000 records.
Go Deeper
The best way to understand how this can change the way you look at your application is to download Loupe Desktop and use it - it's free along with everything you need to do what you've seen here!
If you want to read more about performance monitoring with Loupe, check out these pages in our product documentation:
Performance Counters Recorded
We've combed through the trove of counters available and selected the key ones that are proven to help diagnose application issues.
For the application:
- Process - % Processor Time
- Process - % User Time
- Process - % Privileged Time
- Working Set
- Peak Working Set
- Private Memory Size
- Virtual Memory Size
- Peak Virtual Memory Size
- Paged Memory Size
- Peak Paged Memory Size
- Nonpaged System Memory Size
- Paged System Memory Size
System-wide performance counters:
- System - Processor Queue Length
- Processor - % Processor Time
- Memory - Committed Bytes
- Memory - Available Bytes
- Memory - Pages/sec
For each hard drive:
- Physical Disk - % Disk Time
- Physical Disk - Avg. Disk Queue Length
- Physical Disk - Disk Transfers/sec
- Physical Disk - Disk Bytes/sec
For each high speed network interface:
- Network Interface - Bytes Received/sec
- Network Interface - Bytes Sent/sec
- Network Interface - Current Bandwidth
- Network Interface - Packets Received Errors
- Network Interface - Packets Outbound Errors