Tips for Effective Centralized Logging on .NET
.NET 6 continues some of the larger trends present throughout the development of .NET Core: apps running on more platforms, across more devices, leading to more complicated deployment scenarios. Now more than ever, developers are looking for tools that can help them combat the complications of cross-platform and cluster-based applications.
One of these complications is logging. Whether your logging is spread out across thousands of customer devices, or a cluster of servers, you need to find a way to see those logs when solving problems. That’s what centralized logging does; collects your logs from anywhere they’re written and puts them in one easily accessible, safe location.
It’s one of the best tools for collecting logs no matter the deployment scenario, and an easy way to ensure developers have the data they need. Here, we will discuss how to get the most out of centralized logging on .NET.
- Include More than the Message in Your Logs
- Reduce the Code Complexity Impact of Logging
- Use a Client-Side Logging Agent for ASP.NET Applications
Include More than the Message in Your Logs
The message is the most important part of a log. But, a random list of messages will only get you so far in troubleshooting. Without knowing where errors happen, where they happened, and who’s affected, you’re left with a lot of guesswork.
Recently, I wrote on this topic: the best supplemental data you can add to your logs. The Cliff-Notes version is: the data you need correlates with the log sink you’re using. The supplemental data helpful for console-based log sinks differs from the data valuable for a text file or 3rd party logger, as they’re used in different contexts. I may not need a timestamp for a log written in a real-time debug console, but I certainly need it when writing to a log file viewed hours (or days) after the event.
We like to err on the side of more data over less for centralized logging.
When every instance of your application sends logs to the same location, you require substantial data to organize, sort, and use those logs effectively.
Try to include the following items along with the log message and severity:
- Class and Method
- Stack Trace
- Event ID
- Timestamp (Month, Day, Year, and Time)
- Platform Diagnostic Information (OS, browser version, framework version, etc.)
- Machine Specs (RAM, processors, viewport, etc.)
- User Information (User ID, Username, etc.)
This is a lot to add to every log! But a good centralized logging platform can handle the amount of data and display it in a digestible way.
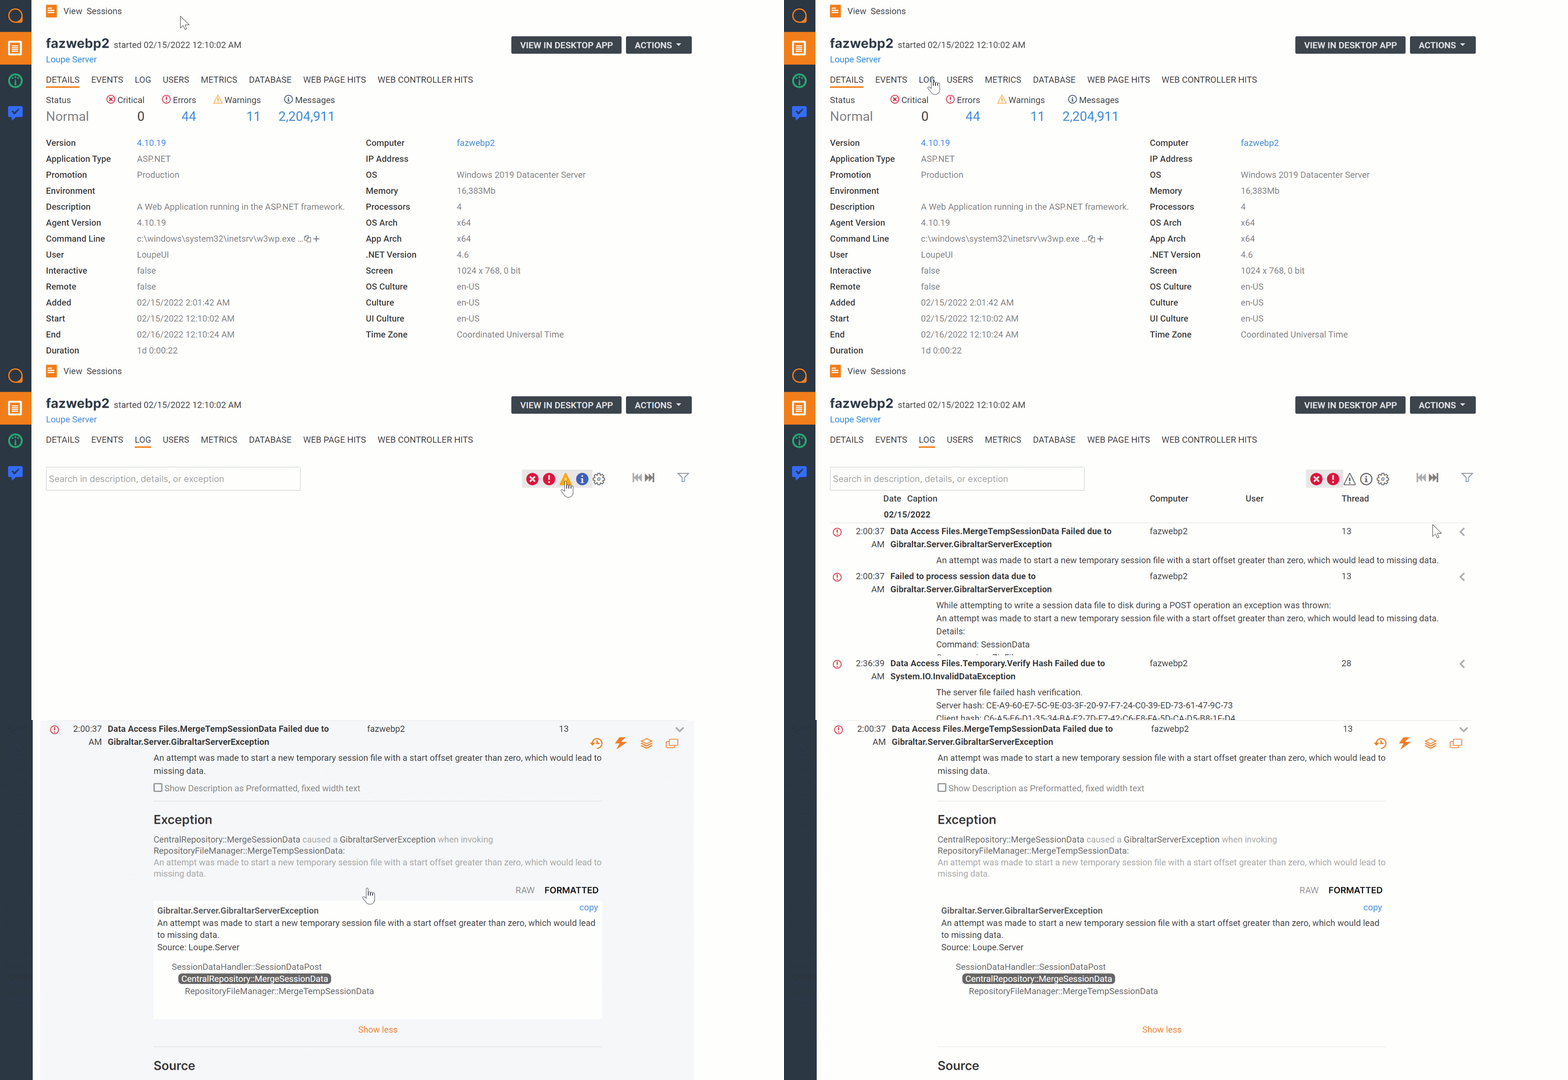
For Loupe, we tend to display consistent data in a session summary tab rather than each log. Items like the OS and machine specs are unlikely to change mid-session, so it’s easier to keep them all on a summary page. We then place changing data like timestamp, stack trace, and method with each log. Below is an example of this design in the upcoming Loupe 5:

The takeaway here is that you want a centralized logging platform that can handle and organize a significant amount of data other than just the log messages.
Why is Supplemental Data Helpful for Centralized Logging?
It’s helpful to include supplemental data because people use logs differently. Including more data helps each person find/use the logs that are valuable to them. Let’s use the Loupe development team as an example.
For many of my colleagues, items like the method, stack trace, platform diagnostic information, etc., are most helpful as they are actively coding fixes for our products. Including this data means they can understand the context for an error without bothering our users.
In my case, this data is nice to have but not essential. I’m not responsible for writing our application logic for Loupe. My day-to-day with Loupe involves more demoing and user support, so how I navigate and use our logs looks very different.
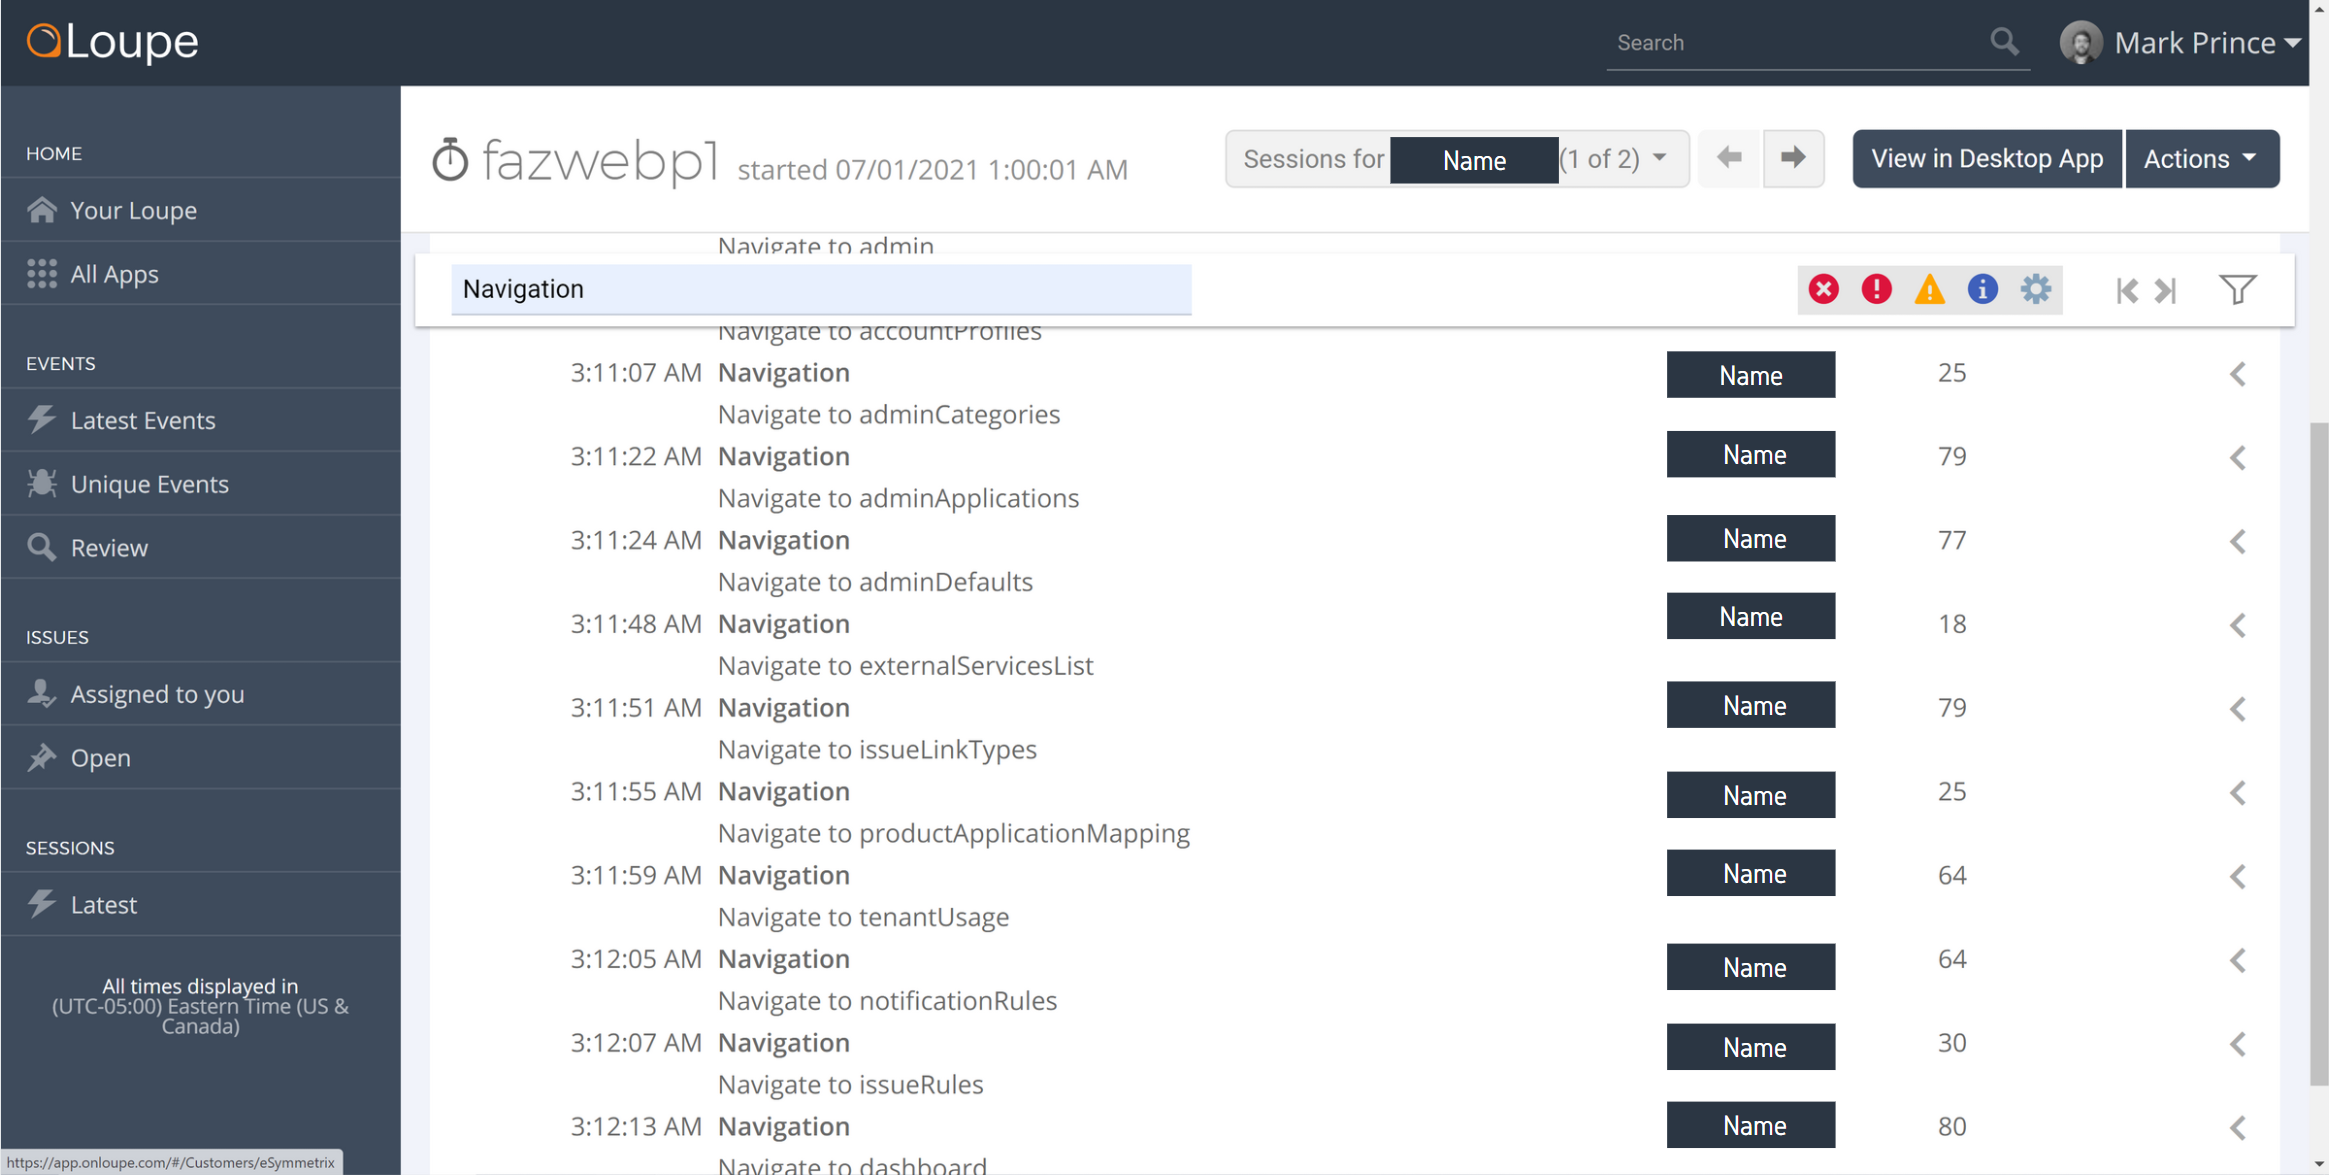
When using our logs, I tend to perform searches with a user email address first, as I’m mainly concerned with resolving user problems in our product trials and websites. Within user sessions, I often look for specific events we label as “Navigation” (acts as an Event ID in this case) to extrapolate what they tried to accomplish during the session and where specifically they ran into problems. Here’s an example in Loupe 4, where I filter the logs in a session to only show the “Navigation” events (with the user names blocked out):

If we didn’t include the user or event data, I would have no luck finding logs from the night before or over the weekend. Identifying user problems and finding solutions would be much more difficult, so I’m thankful to have it.
By including all the data we have, both the active development team and support benefit from centralized logging. It means that our whole organization can benefit from centralized logging, making it a much better investment.
Reduce the Code Complexity Impact of Logging
In the last section, I suggested adding a bunch of data to your logs. But I also know it’s not a “free” choice. There’s a code complexity cost that comes with it. Code is already hard enough to read, and adding multiple complicated logging statements doesn’t help. So, how do you achieve the proper balance, where your logs are dense with data, but your code is clean?
The truth is, I don’t have a complete answer to that question. But there are ways to reduce the degree to which logging contributes to code complexity. Let’s go over a few techniques below.
Use Scopes with Microsoft.Extensions.Logging
If you use Microsoft.Extensions.Logging (which we recommend for any .NET 6 or .NET Core application), you can use the ILogger.BeginScope() method to simplify adding data to a group of log statements.
For example, if I want to log a purchase on an eCommerce website, I can use a scope to include a purchase ID data point in every log, instead of adding it manually to each. Or include a purchase, user, and machine ID. There isn’t a strict limit to what or how much data you can have. So in scenarios where you include a considerable amount of supplemental data in each log, the code reduction can be huge!
Let’s look at a quick example. We created a series of Microsoft.Extensions.Logging unit tests that include a scope test. Here’s a snippet, with the log slightly shortened:
[Fact]
public void Can_Create_Dictionary_Scope()
{
  var logger = _fixture.Factory.CreateLogger(nameof(Can_Create_Dictionary_Scope));

  using (logger.BeginScope(new Dictionary<string, object>
  {
      {"Order", "This is the first scope value"},
      {"OrderQuantity", 2000},
      {"OrderTimestamp", DateTimeOffset.UtcNow}
  }))
  {
      logger.LogInformation("This log message will have three scope elements");

      //now add another inner scope.
      using (logger.BeginScope(new Dictionary<string, object>
      {
          {"Fourth", 4.1D}
      }))
      {
          logger.LogWarning("This log message will have four scope elements");
      }

      logger.LogError("This log message will have reverted to just three");
  }

  logger.LogDebug("This log message will not have any scope elements");
}
This example shows some nested scopes, generating a log with four scope elements, two with three scope elements, and one with no scope elements.
Here are some screenshots of the respective logs and scope elements in Loupe Desktop:
Four Scope Elements

Three Scope Elements

No Scope Elements

Even in this small example, scopes reduced the code complexity quite a bit.
Each actual log only needed to include the severity and message, and the scopes took care of the rest.
Write Global Using Statements for Logging Libraries on .NET 6
Along with the release of .NET 6, there was a C# update: global using statements. Logging is common enough that global using statements make sense for logging dependencies.
Some folks, like myself, appreciate that they clean up repetitive code and leave just the using statements specific to the document. Less using statements means it’s easier to identify the ones more likely to matter.
But, it can make code more difficult to read at first, where you may not know what resources are global, and like using statements for practical context.
This is a small optimization, but one worth discussing. If your development team would appreciate less text at the top of every document, global statements can help.
Let the Centralized Logger Collect and Format Data for You
Writing code to grab the machine specs can be annoying, and a pain to ignore if intrusively included in your application code. So don’t write it yourself! Let the centralized logging system collect that data for you when possible.
For example, with Loupe, the agent will automatically collect a large amount of supplemental data. The Loupe agent can collect items like the machine specs, user information, class, method, and more, meaning you don’t need to write it into a scope or logging statement. Formatting the logs is handled by Loupe as well. It writes logs to binary that is made legible once ingested (this helps us reduce the file size of Loupe logs, meaning they’re easier to send to a centralized logging server and cheaper to store).
These techniques won’t solve code complexity issues completely, but they’re a good start. In general, the more you can push log formatting/data collection out of individual log statements, the better. Microsoft.Extensions.Logging Scopes help do that to a degree, as they reduce the instances of redundant code. But the right centralized logging platform will have the largest effect, as it can remove the need for a substantial amount of formatting/data collection code.
Use a Client-Side Logging Agent for ASP.NET Applications
If you use ASP.NET, Centralized Logging may seem like an arbitrary technology. If most of your application logic is client-side (JavaScript heavy), server-side logging isn’t always helpful. For these scenarios, it makes sense to find a client-side logging agent that works with a centralized logging system. Proper client-side logging allows you to catch JavaScript errors in production that may otherwise go unnoticed and write logs documenting client-side processes.
For Loupe, we’ve had an internal agent for years to create logs such as the navigation example above. Last year, we public versions of the agent for general purposeTypeScript (standard JS, React, etc.) and specifically Angular. If you would like to see a few examples of the agent in action, the following articles include examples:
- Client-Side JavaScript Logging Examples on ASP.NET
- Logging User Navigation for Angular SPAs in ASP.NET
Client-side logging is a topic I care about because my job before this was web development for an eCommerce website.
We didn’t have any form of robust logging, so errors often went unnoticed in production.
The majority of the errors we did find were due to user feedback.
Discussing errors with users is an inconvenient process at its best. It takes time to discuss what happened, pinpoint the error, and piece together a way to reproduce it locally. It’s unrealistic to expect most users to navigate chrome dev tools and read off an error log. Or they may be on a phone where that’s not even an option. At its worst, users could get hostile, and my focus shifted from troubleshooting to damage control.
But this is a solvable problem. With the right centralized logging system, client-side logs will include the same supplemental data you collect from the rest of your application, and can appear alongside server-side logs in sessions. This is valuable because it allows developers to see how the client and server interact in production, and provide the full context for errors on either side.
Want to Get Started with Centralized Logging?
If you are still looking for a Centralized Logging system, or want to see how one works for free, Loupe has a free 30-day trial. It’s a good way to test out some of these tips and see how centralized logging can change your workflow with .NET. You can learn more about the trial in the link below.