Client-Side JavaScript Logging Examples on ASP.NET
The more ASP.NET applications rely on client-side computing, the harder it becomes to keep tabs on them using traditional logging methods. There are a lot of advantages for sure; products like single-page applications would not be possible without the likes of Angular and other forms of JavaScript doing the heavy lifting. But logging those applications effectively during development, and especially during production, gets tricky.
Javascript, by default, is logged through the browser console. This is a fantastic tool for live troubleshooting, but isn’t permanent. If you want to reference a previous error, or see logging from your most recent user sessions across the globe, the browser console won’t cut it.
Luckily, client-side logging tools can solve those issues, such as the Loupe agents for Angular and typescript. Here, we will go over some logging examples using a single-page application on ASP.NET to show how Loupe can be used for JavaScript development.
Directly Logging Variables With Loupe
When working with JavaScript, I often directly log client-side logic to the browser console, like tracking a variable in a for loop. Logging variables manually can give you insight into application logic that’s not visible on the front-end, but is crucial for routine operation. So, let’s start by taking a look at the counter component in the ASP.NET Core Angular template. Below is the body of the page:
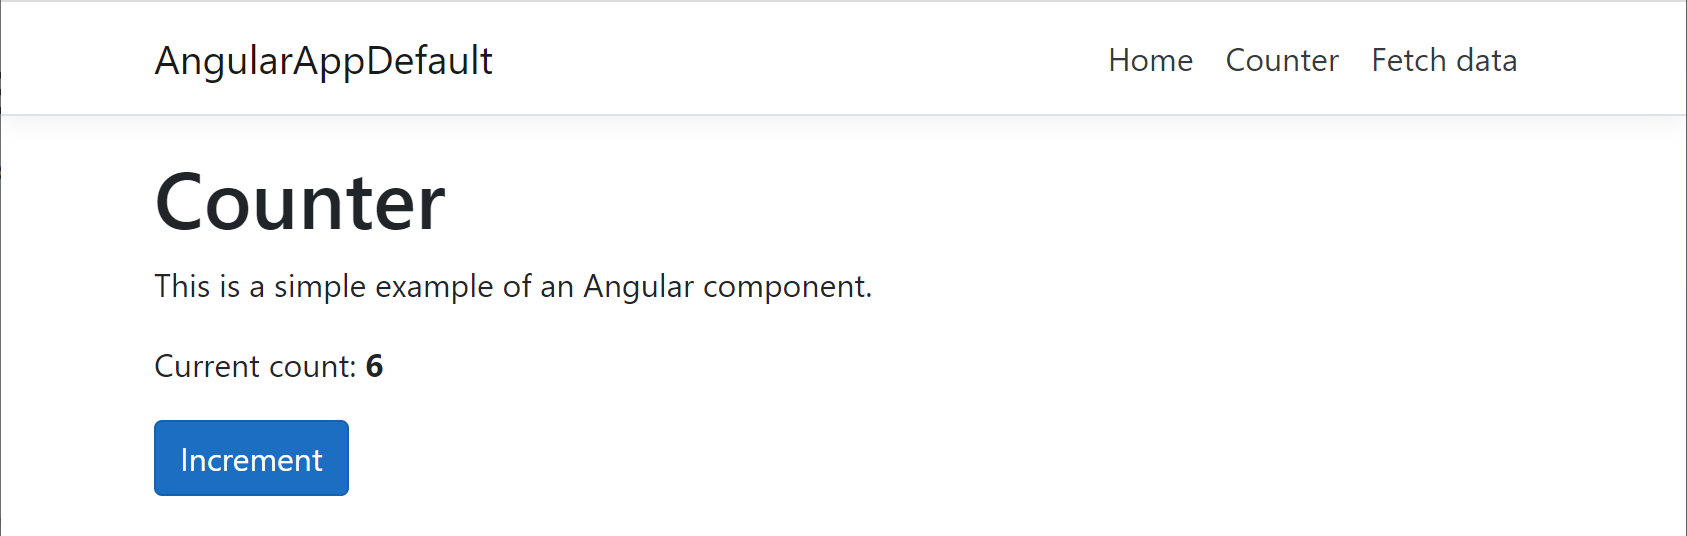
<!--counter.component.html-->

<h1>Counter</h1>

<p>This is a simple example of an Angular component.</p>

<p aria-live="polite">Current count: <strong>{{currentCount}}</strong></p>

<button class="btn btn-primary" (click)="incrementCounter()">Increment</button>
The value of the “Current count” item on the page is equal to the {{currentCount}} variable. It’s modified by clicking the “Increment” button, which calls the incrementCounter() function:
//counter.component.ts

  public incrementCounter() {
    this.currentCount++;
}
This application is extremely basic, but operates primarily on the client side. So as an example, I’ll log the value of the {{currentCount}} variable every time the “Increment” button is pressed. Let’s start by logging it to the browser console:
//counter.component.ts

console.log("currentCount is " + this.currentCount);
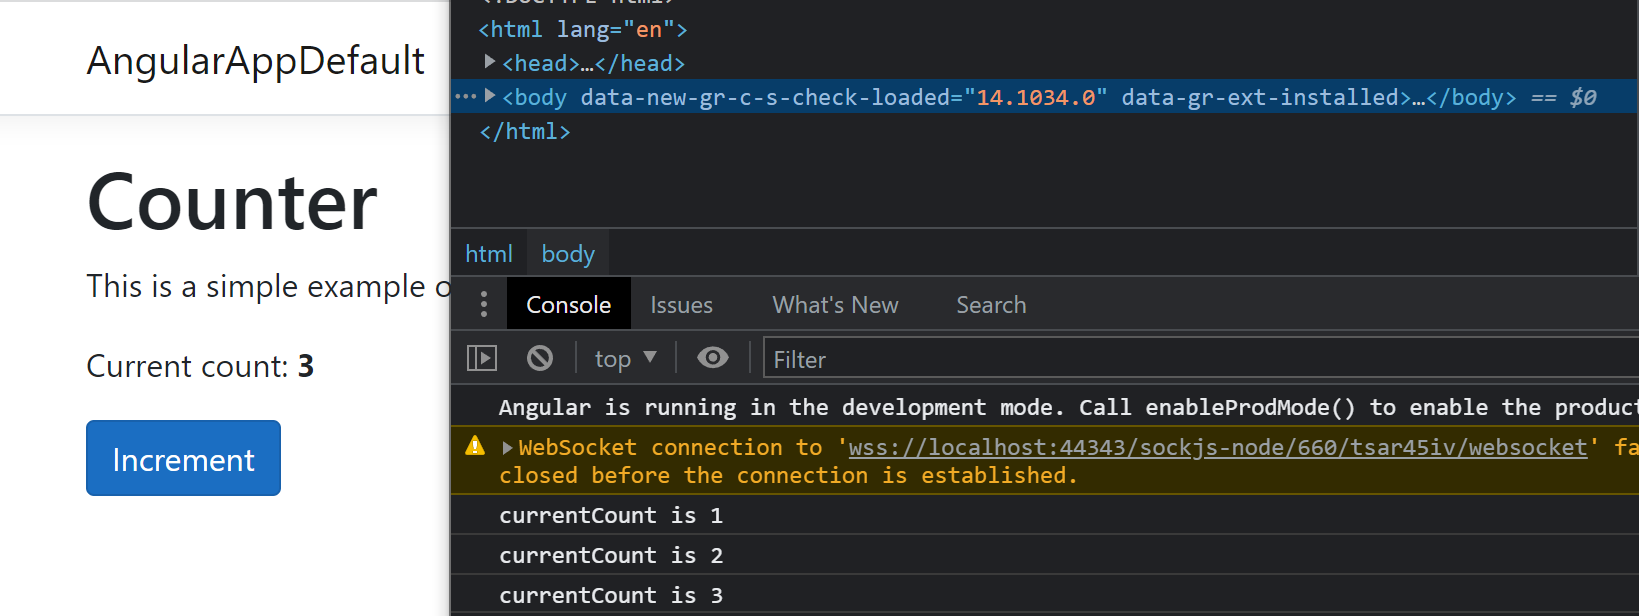
It works, but it’s not very useful. First of all, I can see the current count on the web page itself! In an actual development scenario, it’s doubtful I would need to log the variable like this at all. Any problems would be evident on the page. But even if this value wasn’t visible on the page, once I close the browser, the logs are gone, and I can no longer reference them.
In some cases, that’s okay. If I’m working alone on a quick fix, that’s likely all I’ll need. But when working on a more significant issue, maybe with a larger team, we will want a record to reference later. So let’s write to Loupe using the Angular client-side logging agent instead:
//counter.component.ts

this.loupe.information('JavaScript', 'Counter Component',
'currentCount is ' + this.currentCount,null, null, null, null);
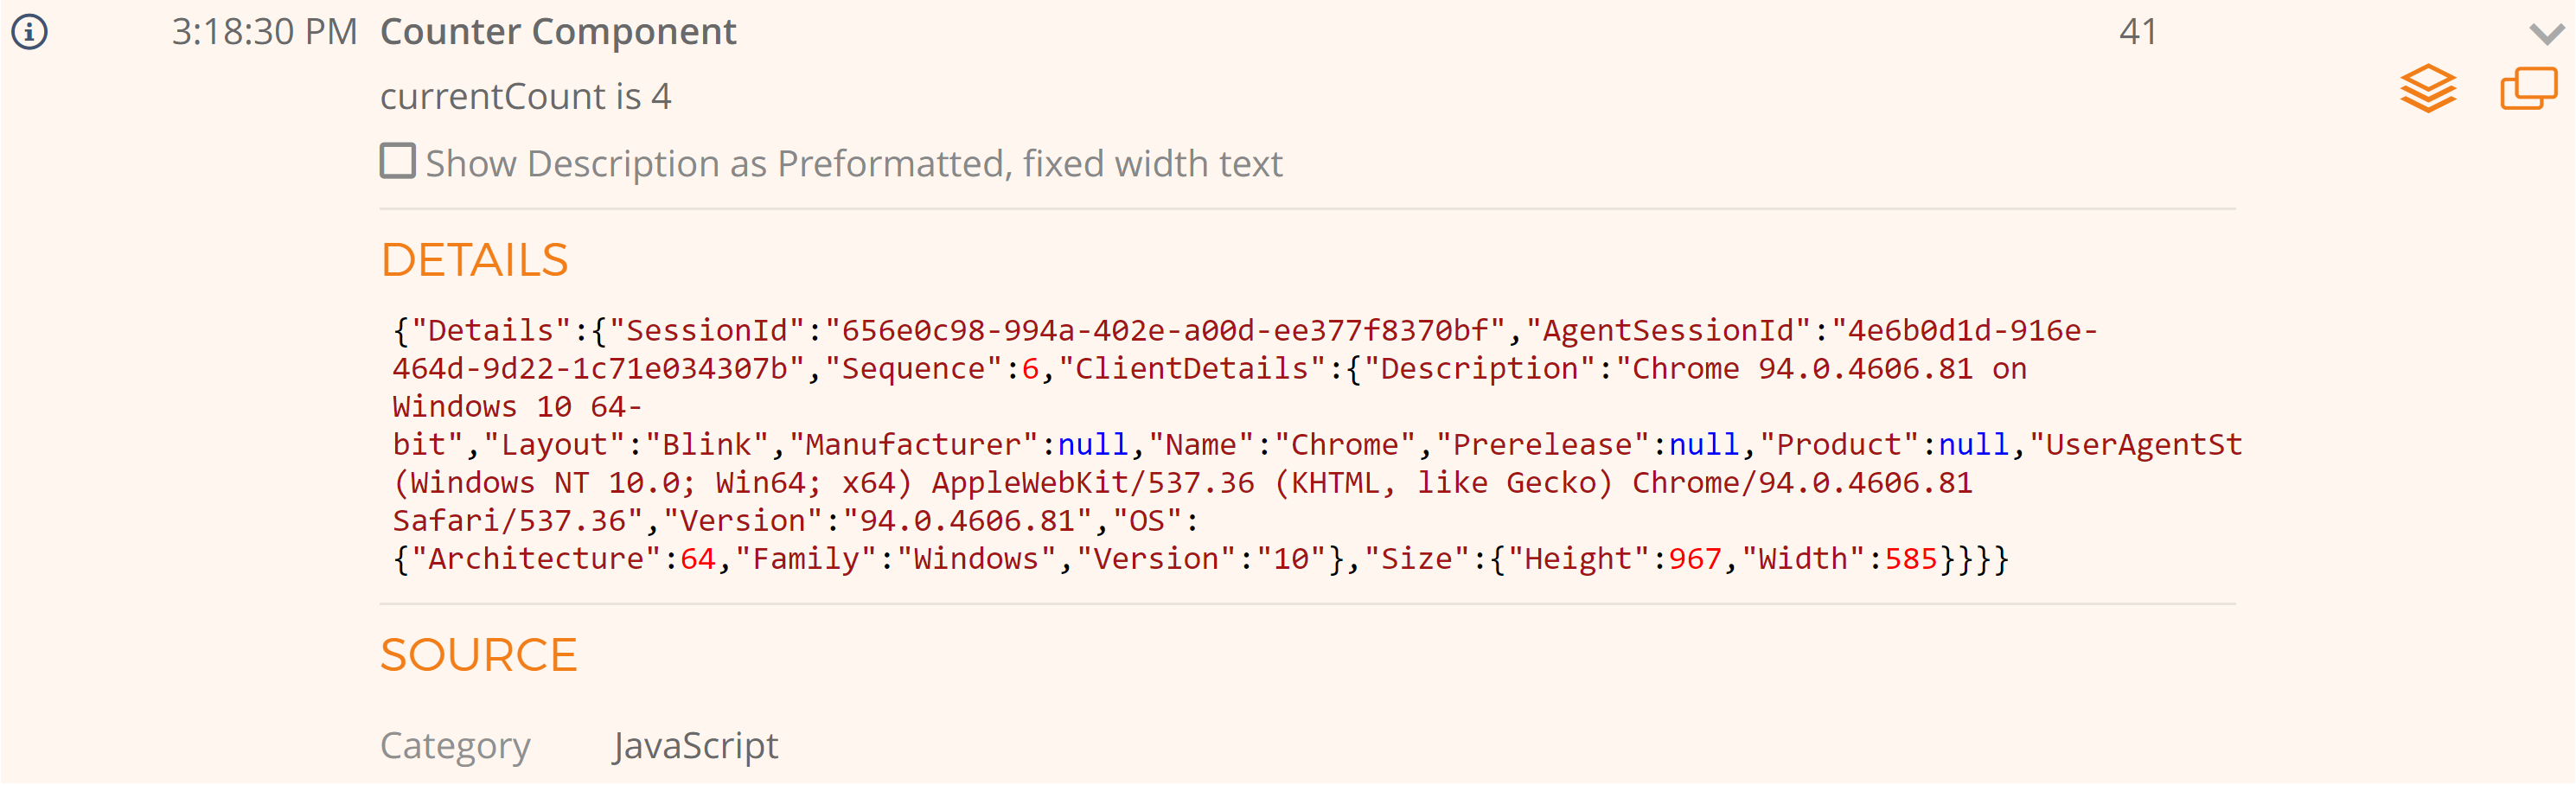
While developing locally, I can use Loupe Desktop to record and save my client-side logging, and view the session as it occurs. Live log viewing is the same kind of workflow I enjoy with the browser console, but with Loupe I’m using a dedicated .NET log viewer. I get a real-time look at both my JavaScript and the .NET side of the application simultaneously.
In this case, I have the application integrated with my Loupe trial, so I can access the logs once the session ends, from any computer. Each log includes a complete set of details, such as browser version, screen dimensions, operating system, and more.
It’s worth noting for this example, I used the Loupe Angular agent, but Loupe can work with other types of JavaScript using the Loupe Typescript agent. So whether you’re using Angular or some other form of JavaScript, Loupe can still work with your solution.
Handling JavaScript Errors With Loupe
It’s likely that for the production version of my application, I would remove the manual logging. But I still want to log errors. So, using the same counter component, let’s set it to error when the {{currentCount}} value hits five. Here’s the error in the browser console:
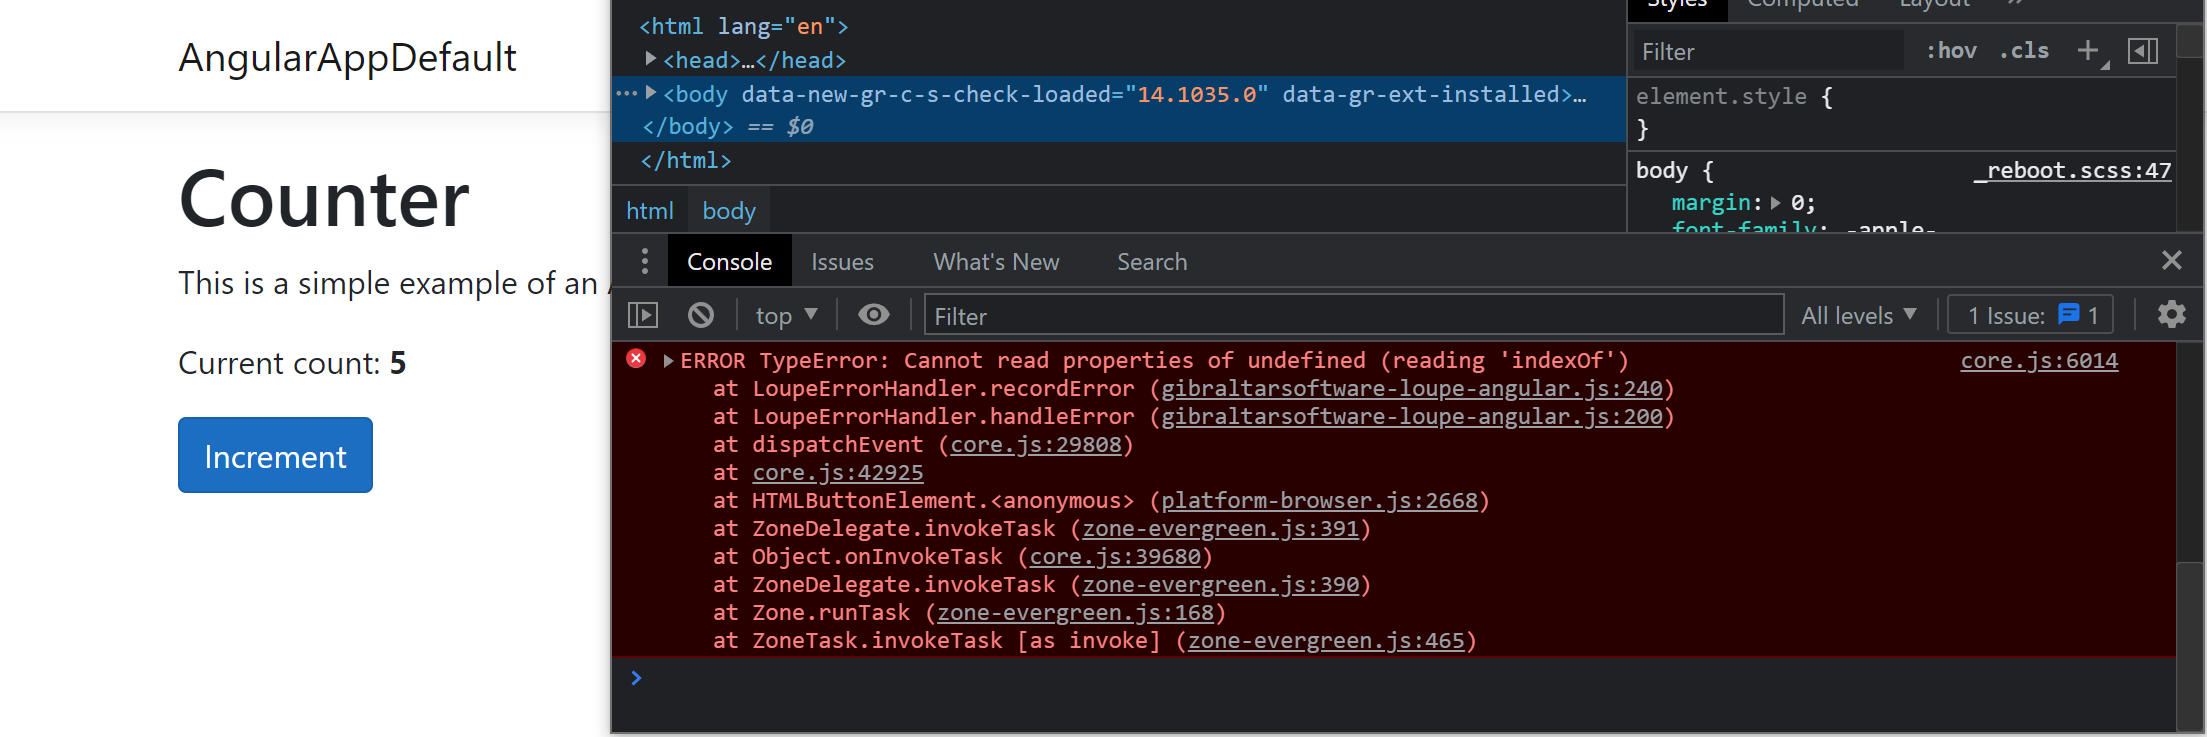
Frankly, it’s awesome that browser dev tools are just always there. Whenever I’ve worked with JavaScript in the past, I’ve spent a decent amount of time in dev tools, looking through the browser console to investigate what went wrong (and I still do). But I spent significant time copy and pasting error logs to save for later. It isn’t enjoyable. Luckily, the Loupe agent recognizes errors and records errors as well. This takes a lot of effort out of saving/remembering problems yourself, and makes working with others much easier. To get started, all we need to do is add the Loupe error handler as a provider:
//app.module.ts
providers: [
  { provide: ErrorHandler, useClass: LoupeErrorHandler }
]
This will call the default Loupe error handler, which will show the same error in the session logs, along with additional details to use while troubleshooting. Here’s an example of the same error log, but sent to my Loupe Server repo:
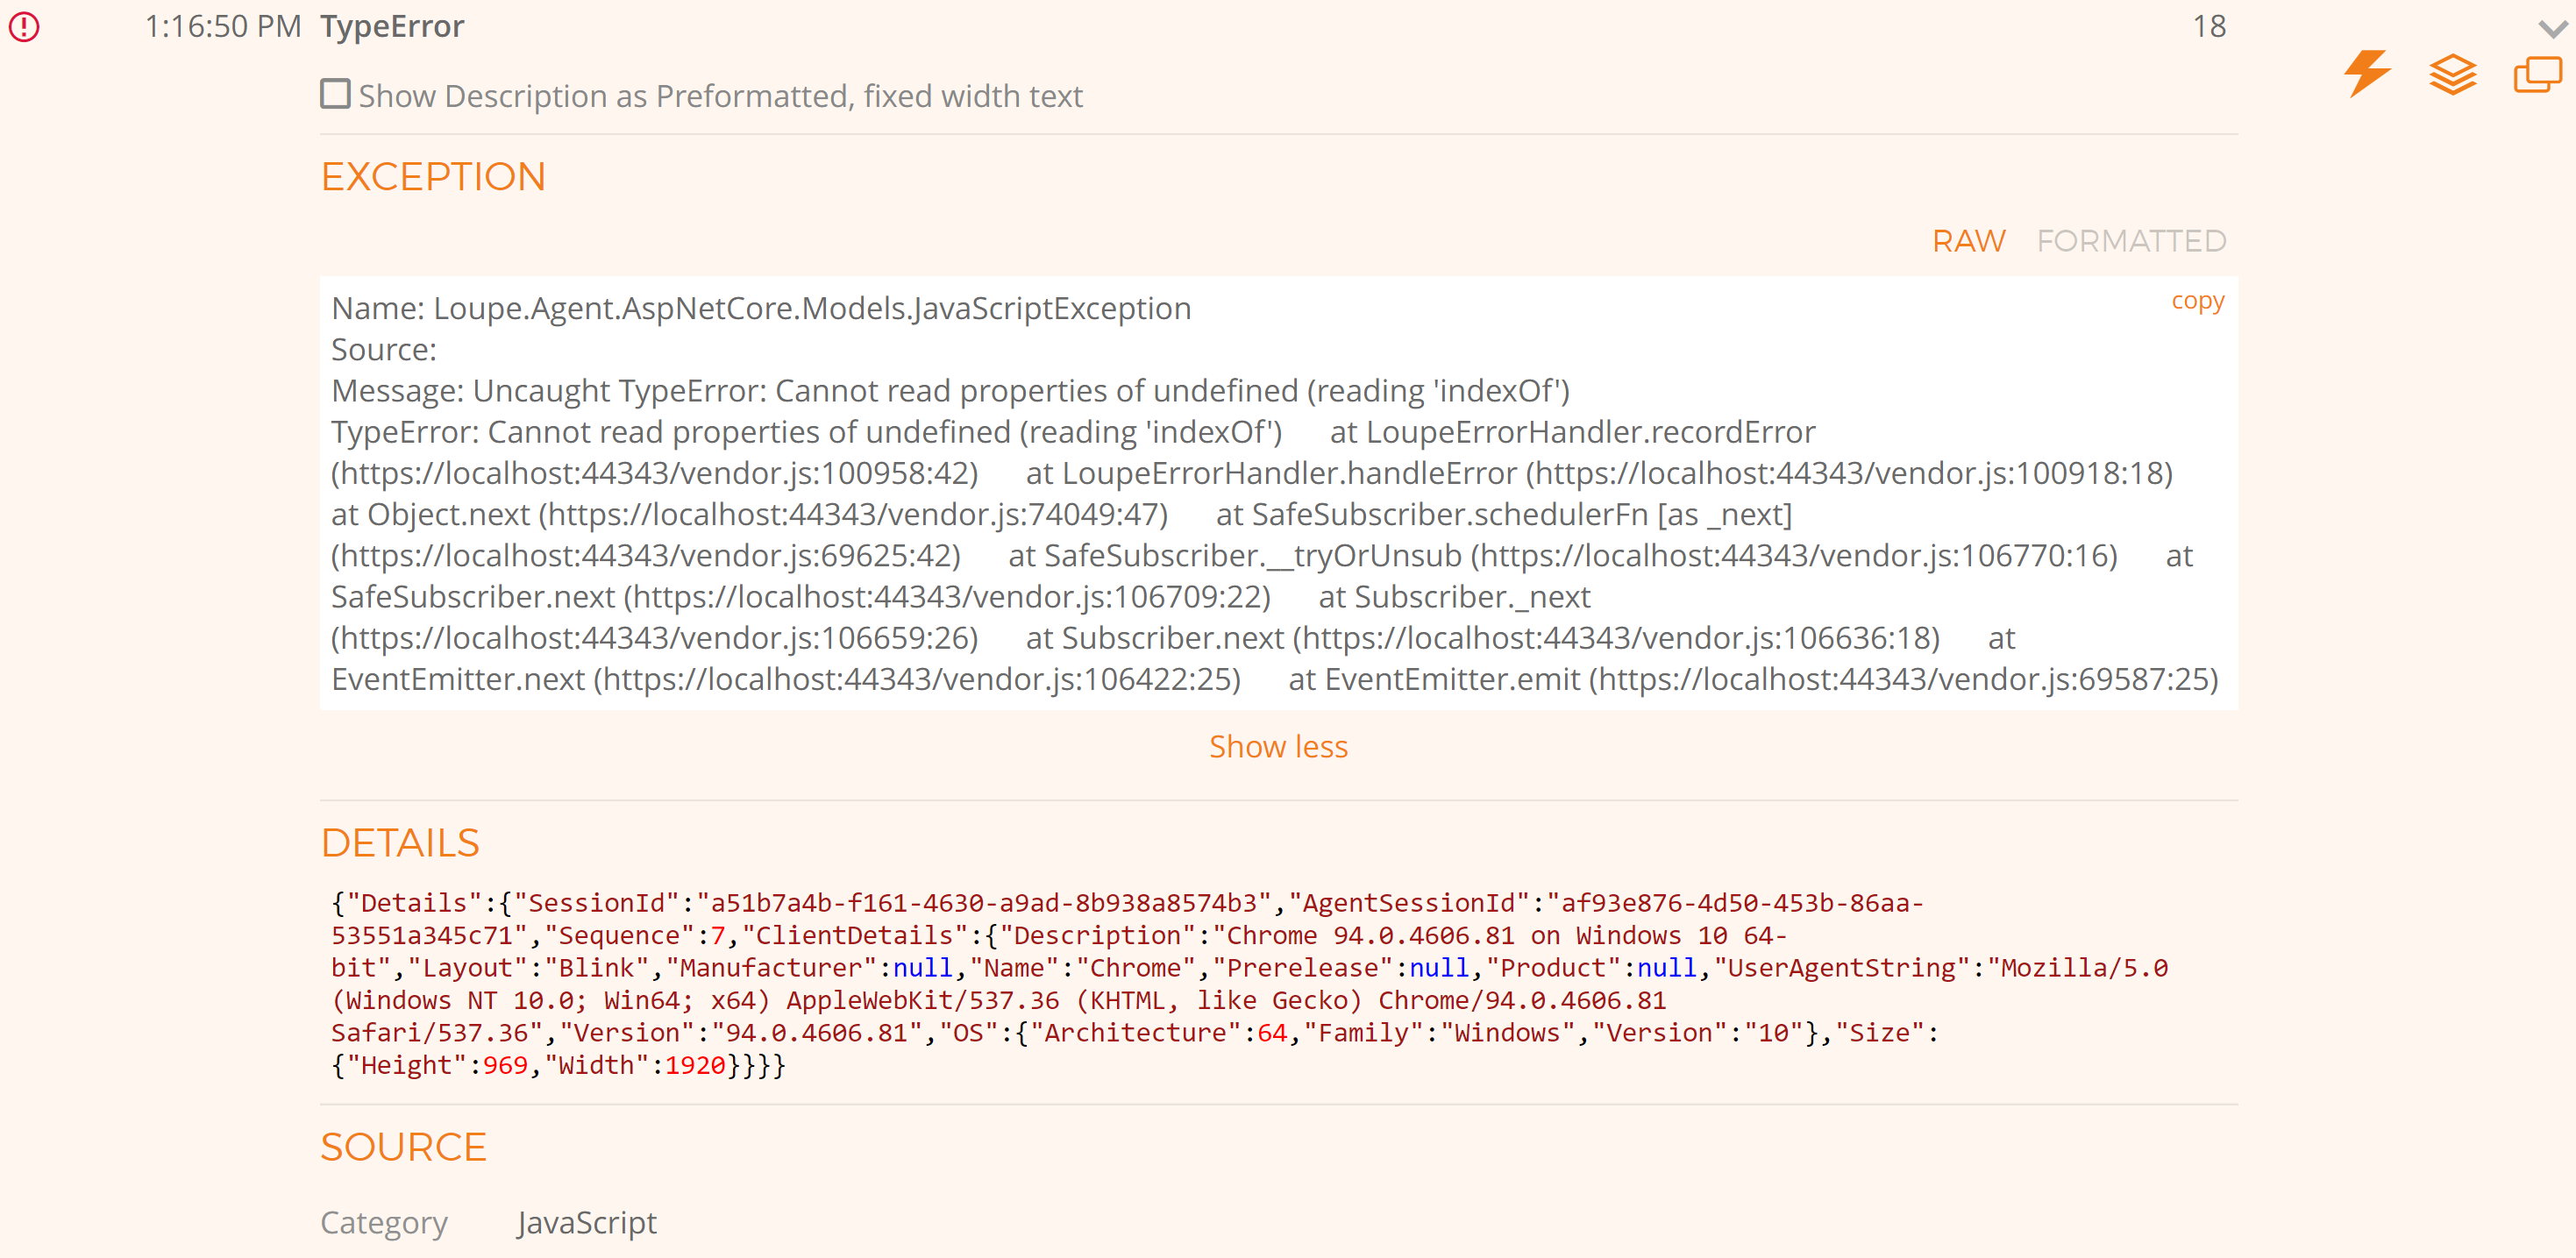
Tracking client-side javascript errors is helpful during development, but really at its best when the application is out in production and combined with centralized logging. When the app is in your users’ hands, the chance of you seeing the JavaScript errors they run into without a form of client-side, centralized logging is low, and you won’t get detailed user feedback every time they do run into a problem. By sending detailed error logs to a single accessible location, you give yourself the best chance at resolving errors as they first occur.
Loupe for JavaScript Provides Permanent, Centralized Storage
The best way to see if the Loupe client-side logging agents are suitable for your project is to give them a spin. You can start locally with Loupe Desktop, which is completely free and will store your JavaScript logs locally for the long haul. If you are interested in centralized logging for production apps, try our free trial of Loupe Server. I used my trial repo for the examples in this article, and use it for pretty much any other example I’ve written for the blog. You can learn more about the trial in the link below.