Logging User Navigation for Angular SPAs in ASP.NET
Recently I learned the value of tracking navigation events while revamping our user trial. The process started with me looking through user session data, which included navigation event logs a lot like this:
The navigation patterns revealed a significant problem with the trial experience. Users traveled to locations we did not expect and were greeted with empty (sometimes broken looking) menus.
The menus were empty because they didn’t have any data! There are no errors to view in a brand new Loupe repo, no issues made, and no session data to explore. It makes sense from the program’s perspective, but is not great for the user. The solution was pretty easy: add contextual, educational content to those pages. But the entire process made me realize how important it is to log navigation events.
Navigation is a significant user action, the kind of thing you want to log in your application. But our application doesn’t do it naturally; it’s a Single Page Application built with angular. As far as the server is concerned, our users go to one page and don’t move from there. Without creating the navigation event log messages, we wouldn’t have discovered the problem in the first place.
So, how can you write these navigation logs for your app? The short answer is: With client-side logging, you can log navigation events through the AppComponent and store them alongside the rest of your application logs —no matter where the application runs. Here, we’ll go over the difficulties of tracking user navigation in a Single Page Application, and how you can log them in ASP.NET using Loupe.
Why is Logging the Navigation Problematic?
Single Page Applications (SPAs), by their definition, take place on one web page, with users moving from different application views thanks to routing. Routing allows for SPAs to have a multi-page styled structure while never requiring the page to actually change.
In practice, making the entire application function on a single page can improve performance and make development easier.
But it doesn’t play well with traditional navigation tracking tools designed to track users on multi-paged websites.
If you’re not mindful about tracking navigation through the router events,
it will be tough to know the user’s view at any given time.
What About Using Google Analytics?
You can absolutely use Google Analytics to track navigation, even in a SPA. There’s a tutorial right here. The Google Analytics setup for a SPA is slightly different than the default scenario but accounted for. But it’s important to note that Google Analytics is designed for the marketing team, not application support and developers. Those folks may want to find a different solution:
-
Google Analytics data isn’t stored with your application logs. When troubleshooting, it can be troublesome to try and piece the data together from two different tools. When trying to follow a series of events that led to an error, hopping between Google Analytics data and your application logs can get quite annoying. What you really want is a method that stores navigation event logs with the rest of your log data, so you can have it as context for any problems that occur (or reveal the problem).
-
Google Analytics does have a performance hit. Under most circumstances, it’s worth it. Google Analytics is a great tool. And considering the value it has for a marketing team, it’s pretty lean. But if the app needs a performance edge, and marketing’s not concerned about tracking user activity in-app, you can skip it for a slight benefit.
Under most circumstances, you want to track user navigation in both Google Analytics and the logs. This way, marketing has the data where they need it, and the application support, ops, and developers have the data alongside the rest of their application logs.
What About Using the Browser Console?
It’s likely if you develop any web app, you are familiar with tracking problems through the browser console. If you just wanted to log navigation data to the browser console as well, you can do it through the App Component like so:
import { Component } from '@angular/core';
import { Router, NavigationStart, RouterEvent } from '@angular/router';
import { filter } from 'rxjs/operators';


@Component({
  selector: 'app-root',
  templateUrl: './app.component.html'
})
export class AppComponent {
  title = 'app';

  constructor(private router: Router) {
    this.router.events
      .pipe(filter(x => x instanceof NavigationStart))
      .subscribe((evnt: RouterEvent) => {
        console.log("NavigationStart " + evnt.url);
      });
  }

}
With this code, the NavigationStart event will trigger a log containing the corresponding destination in the console:
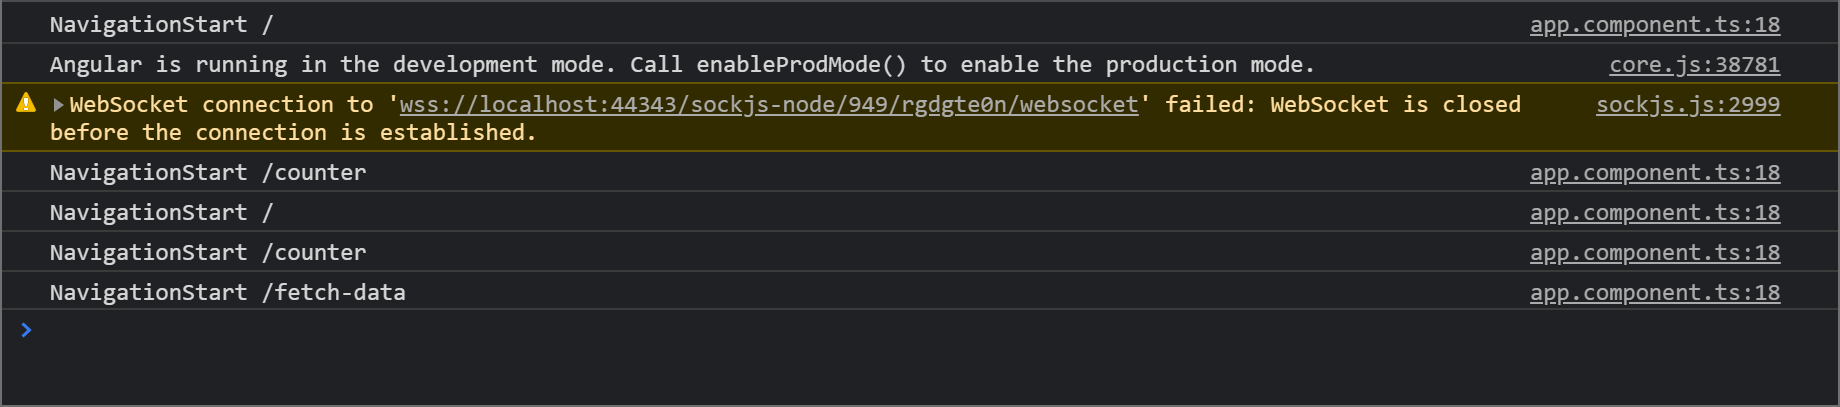
Creating the log for the navigation event itself is simple. But there is one problem: logging these events into the browser console doesn’t reveal anything you couldn’t find by just looking at the URL.
Ultimately, the problem isn’t writing navigation events to logs; it’s ensuring those logs are in an accessible location that doesn’t require the session to be active. This way, you can reference the user’s activity while solving problems at a later time.
This situation is why client-side logging exists.
Tracking Navigation with Client-side Logging
You can effectively collect and store log data for future use by adding client-side logging to your application. Client-side logging allows you to send the angular log data to a permanent location for future reference.
Client-side logging is powerful on its own. When combined with navigation data, it’s even better.
That’s because not only does it provide a collection of error logs from past sessions to reference while troubleshooting,
the navigation logs can be seen alongside errors and show evidence of the user’s intent.
Knowing where a user navigated tells me a lot about what they wanted to do.
With that knowledge, it’s much easier to start troubleshooting problems and find potential usability issues with the application.
Using client-side logging and navigation event tracking was the only reason we discovered the problems with our user trial. The good news is, any Loupe user can do the same thing we do with the client-side logging agent.
Setting Up Loupe Client-Side Logging
There are two different Loupe applications, Loupe Server and Loupe Desktop. Let’s start by using Loupe Desktop, as it’s free and a good fit for the early stages of a project. It’s a great way to see the log data Loupe can collect without putting in any investment.
You can install the Loupe Angular Agent through npm and then follow the directions for adding the ASP.NET Core agent here (or alternatively watch me set it up here). In short, you initiate the Loupe agent in the host builder along with any additional agents you want to use:
public static IHostBuilder CreateHostBuilder(string[] args) =>
  Host.CreateDefaultBuilder(args)
    .AddLoupe(builder => builder.AddAspNetCoreDiagnostics()
        .AddClientLogging() //The Loupe endpoint for client logging
        .AddPerformanceCounters()) //Windows Perf Counter monitoring
        .AddLoupeLogging()
    .ConfigureWebHostDefaults(webBuilder =>
    {
        webBuilder.UseStartup<Startup>();
    });
Specifically for client-side logging, you will need to modify the startup process, add the Loupe Cookie in the startup.cs configure method:
public void Configure(IApplicationBuilder app, IWebHostEnvironment env)
{
  // ...

  app.UseStaticFiles();
  app.UseLoupeCookies(); // Add Loupe cookie-handling
  app.UseRouting();
  app.UseAuthorization();

  // ...
}
As well as map the browser’s log endpoint:
 public void Configure(IApplicationBuilder app, IWebHostEnvironment env)
 {
  //...

  app.UseEndpoints(endpoints =>
  {
      endpoints.MapControllerRoute(
        name: "default",
        pattern: "{controller}/{action=Index}/{id?}");
      endpoints.MapLoupeClientLogger();
  });

  //...
 }
Logging the Navigation Event through Loupe
With Loupe, you can log router events through the AppComponent, as I did with console.log(), but using Loupe as the sink instead.
import { Component } from '@angular/core';
import { Router, NavigationStart, RouterEvent } from '@angular/router';
import { LoupeService } from '@gibraltarsoftware/loupe-angular';
import { filter } from 'rxjs/operators';


@Component({
  selector: 'app-root',
  templateUrl: './app.component.html'
})
export class AppComponent {
  title = 'app';

  constructor(private router: Router, private readonly loupe: LoupeService) {
    this.router.events
      .pipe(filter(x => x instanceof NavigationStart))
      .subscribe((evnt: RouterEvent) => {
        this.loupe.information( //Write the log directly to Loupe
          "Angular", "NavigationStart", evnt.url,
          null, null, null, null
        );
      });
  }

}
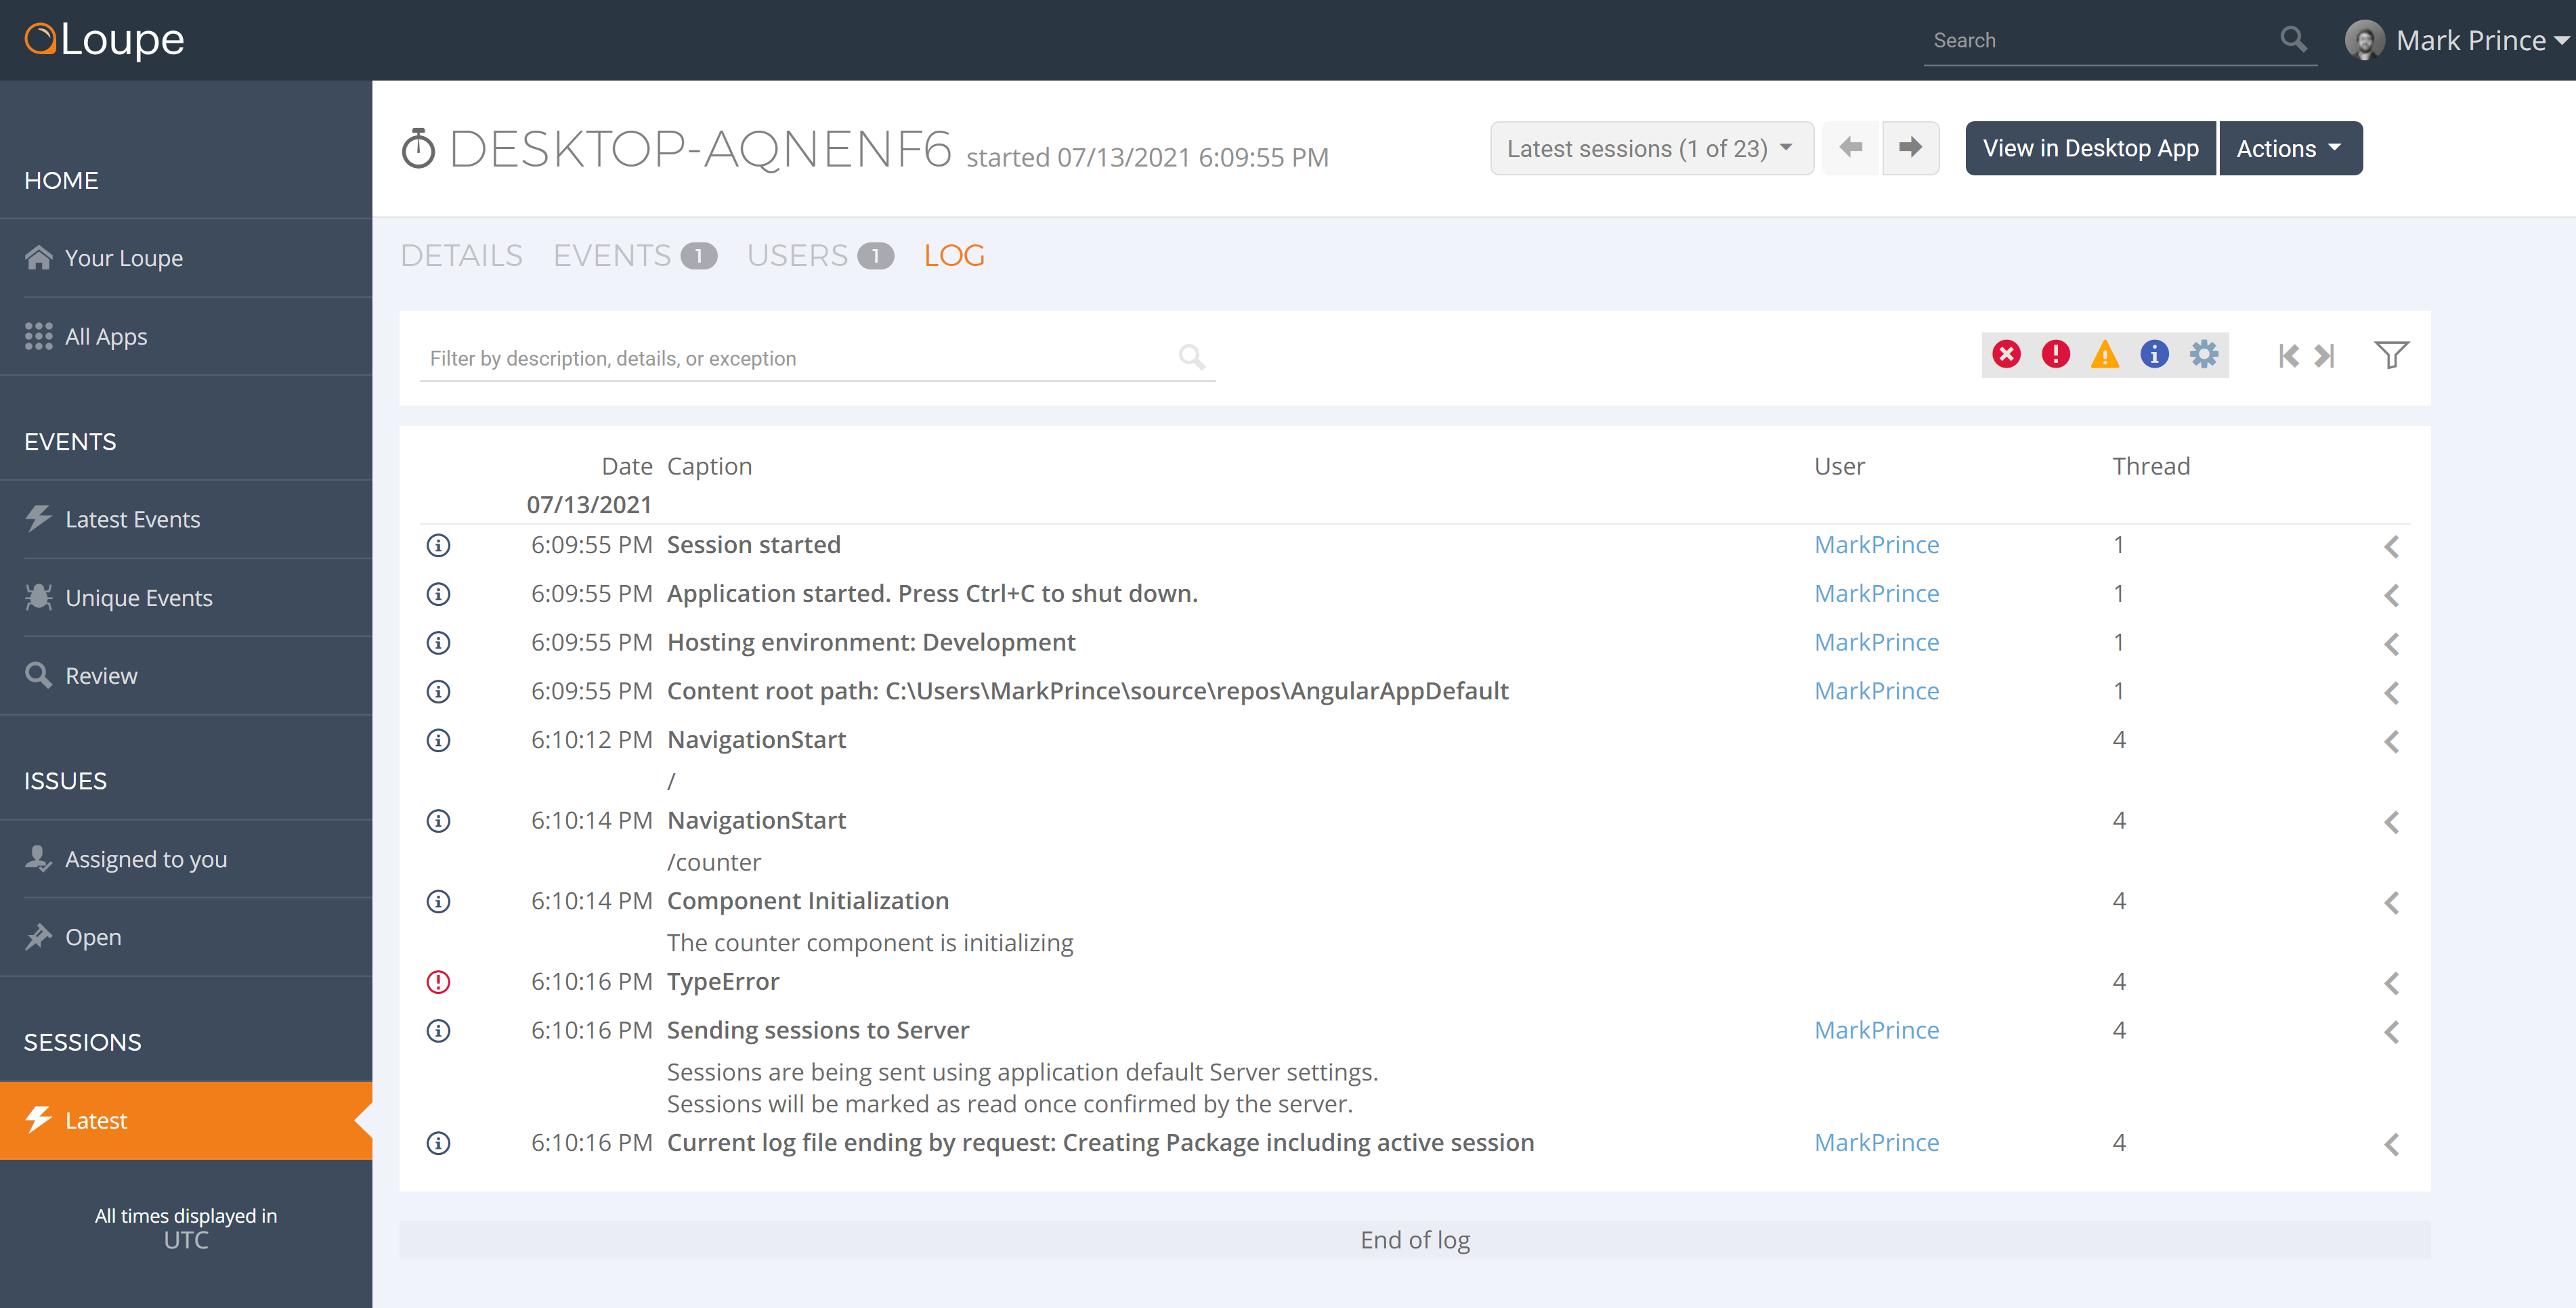
The code above detects router events, specifically NavigationStart, and creates an info log entry sent to Loupe. Here’s what the logs look like in Loupe Desktop:
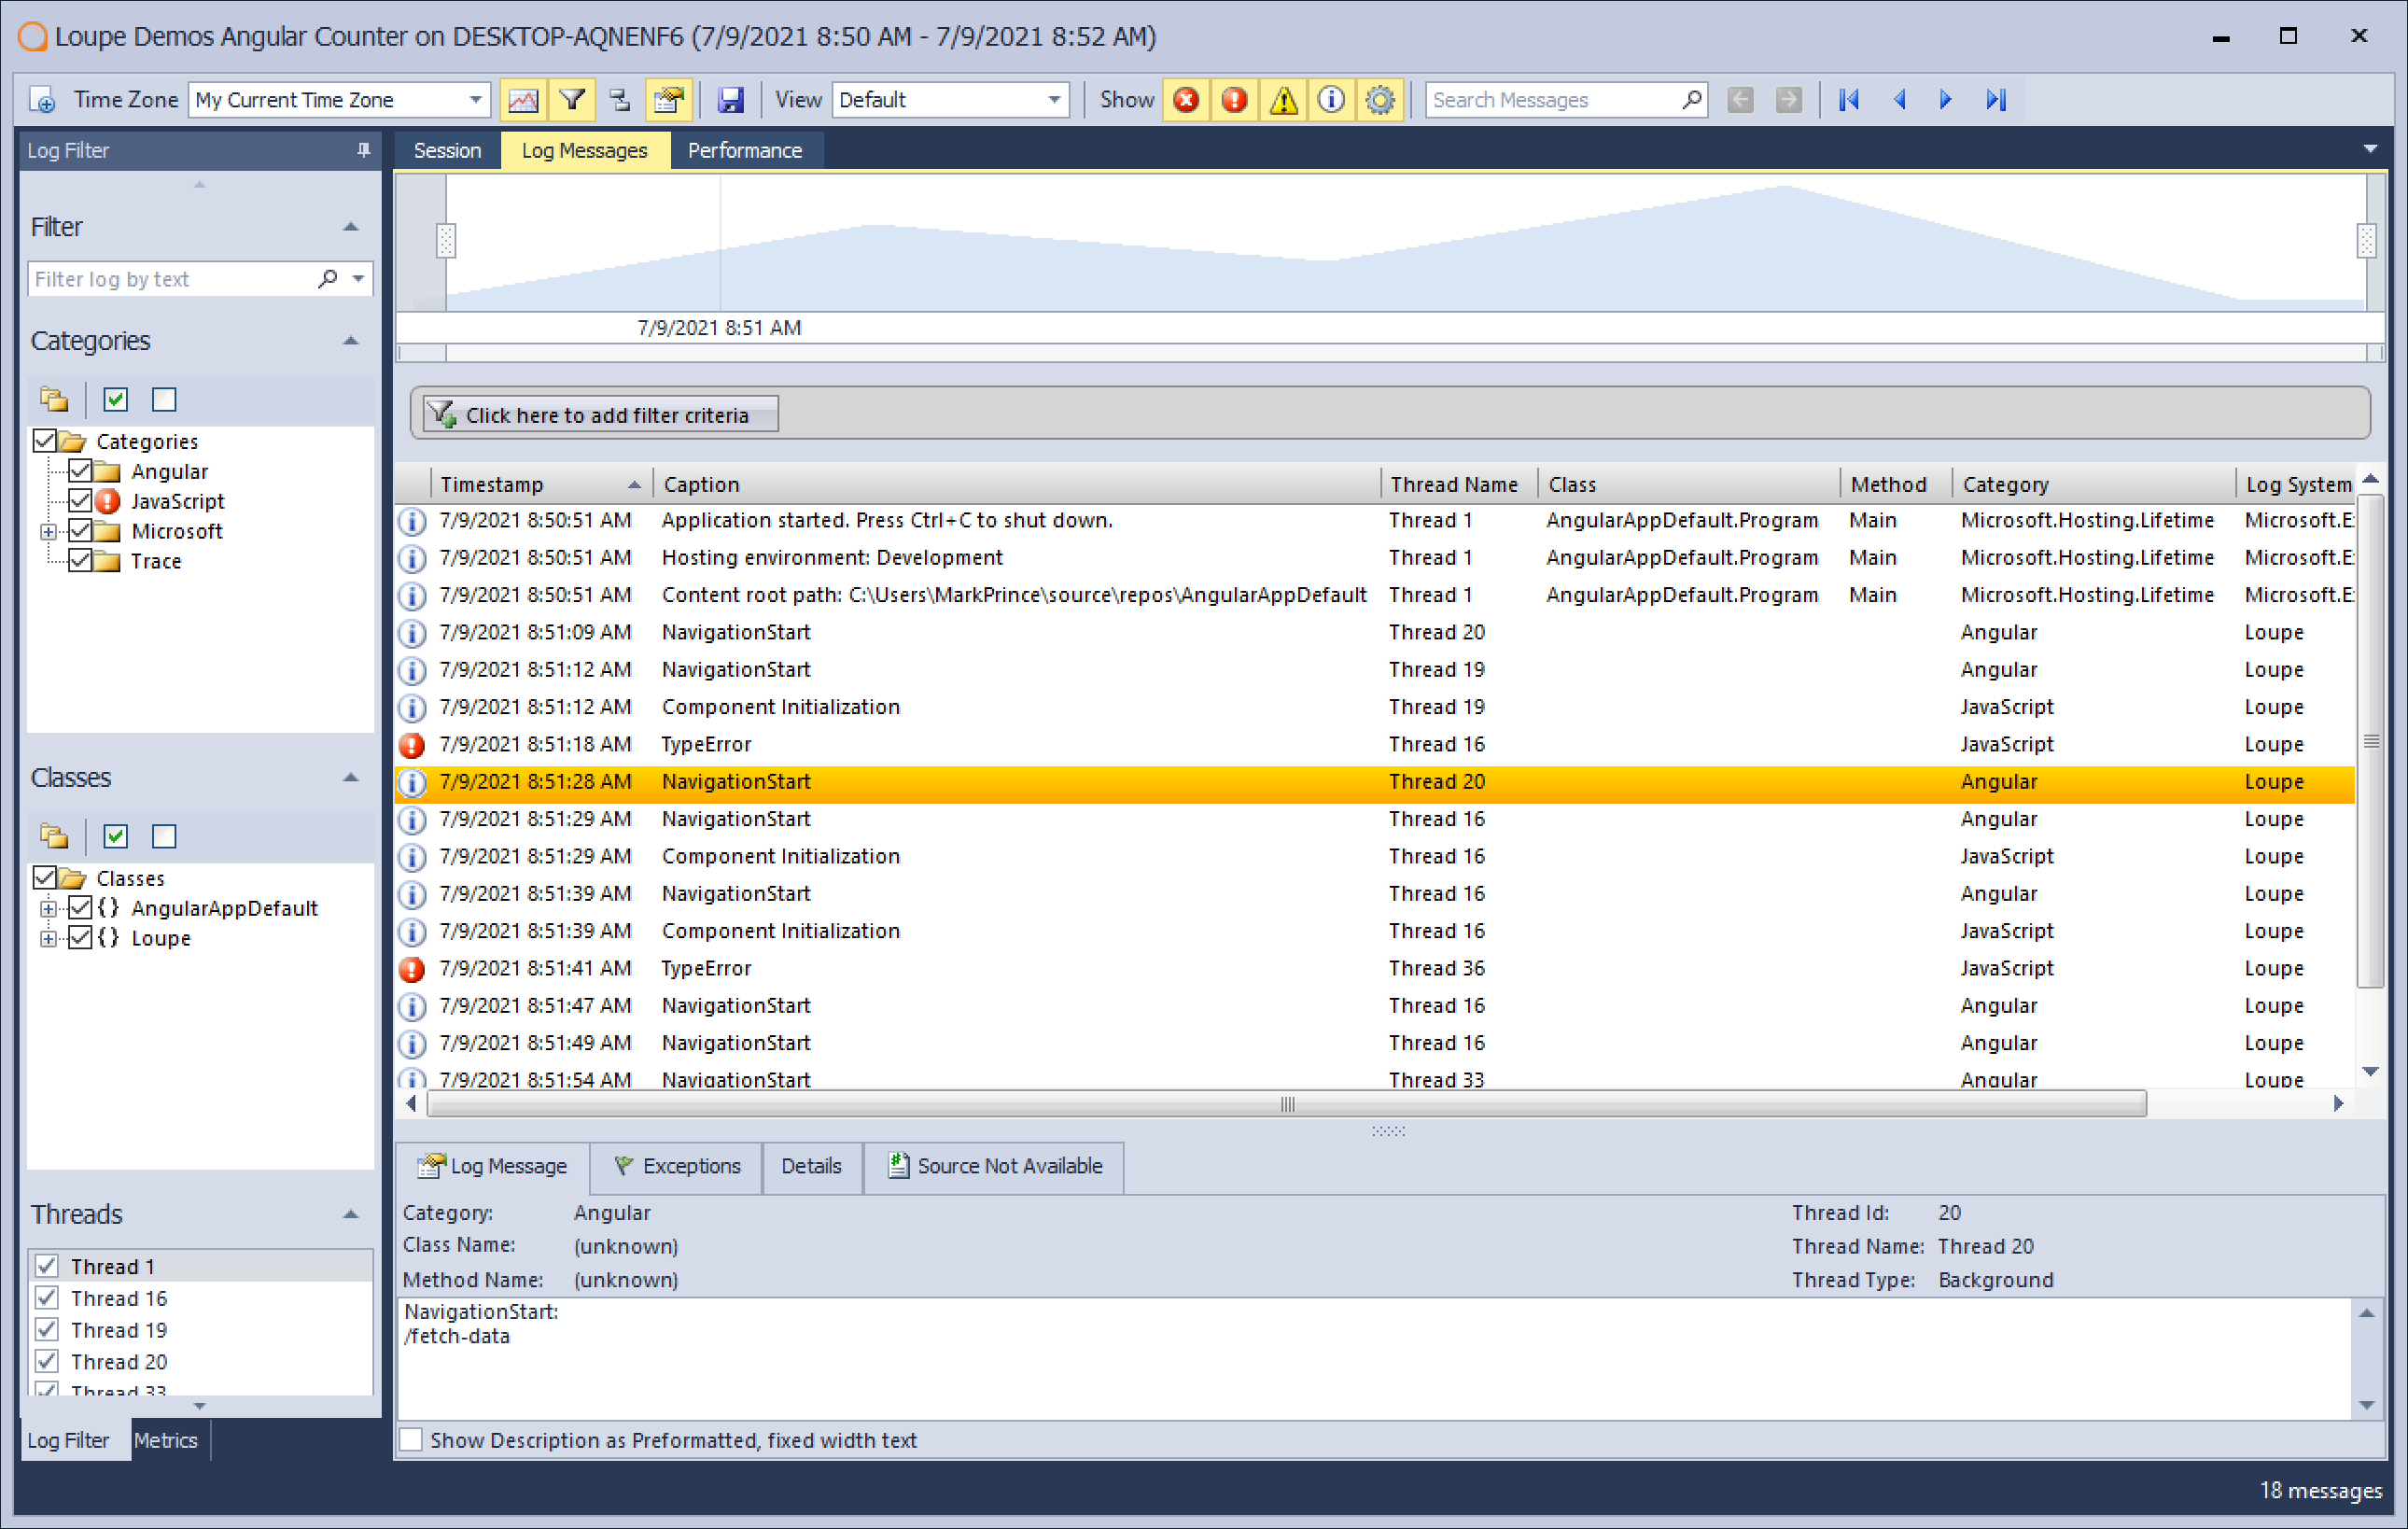
The navigation logs appear alongside all your other log data, providing full context for the entire session.
Additionally, Loupe collects more data that can be found in the log details:
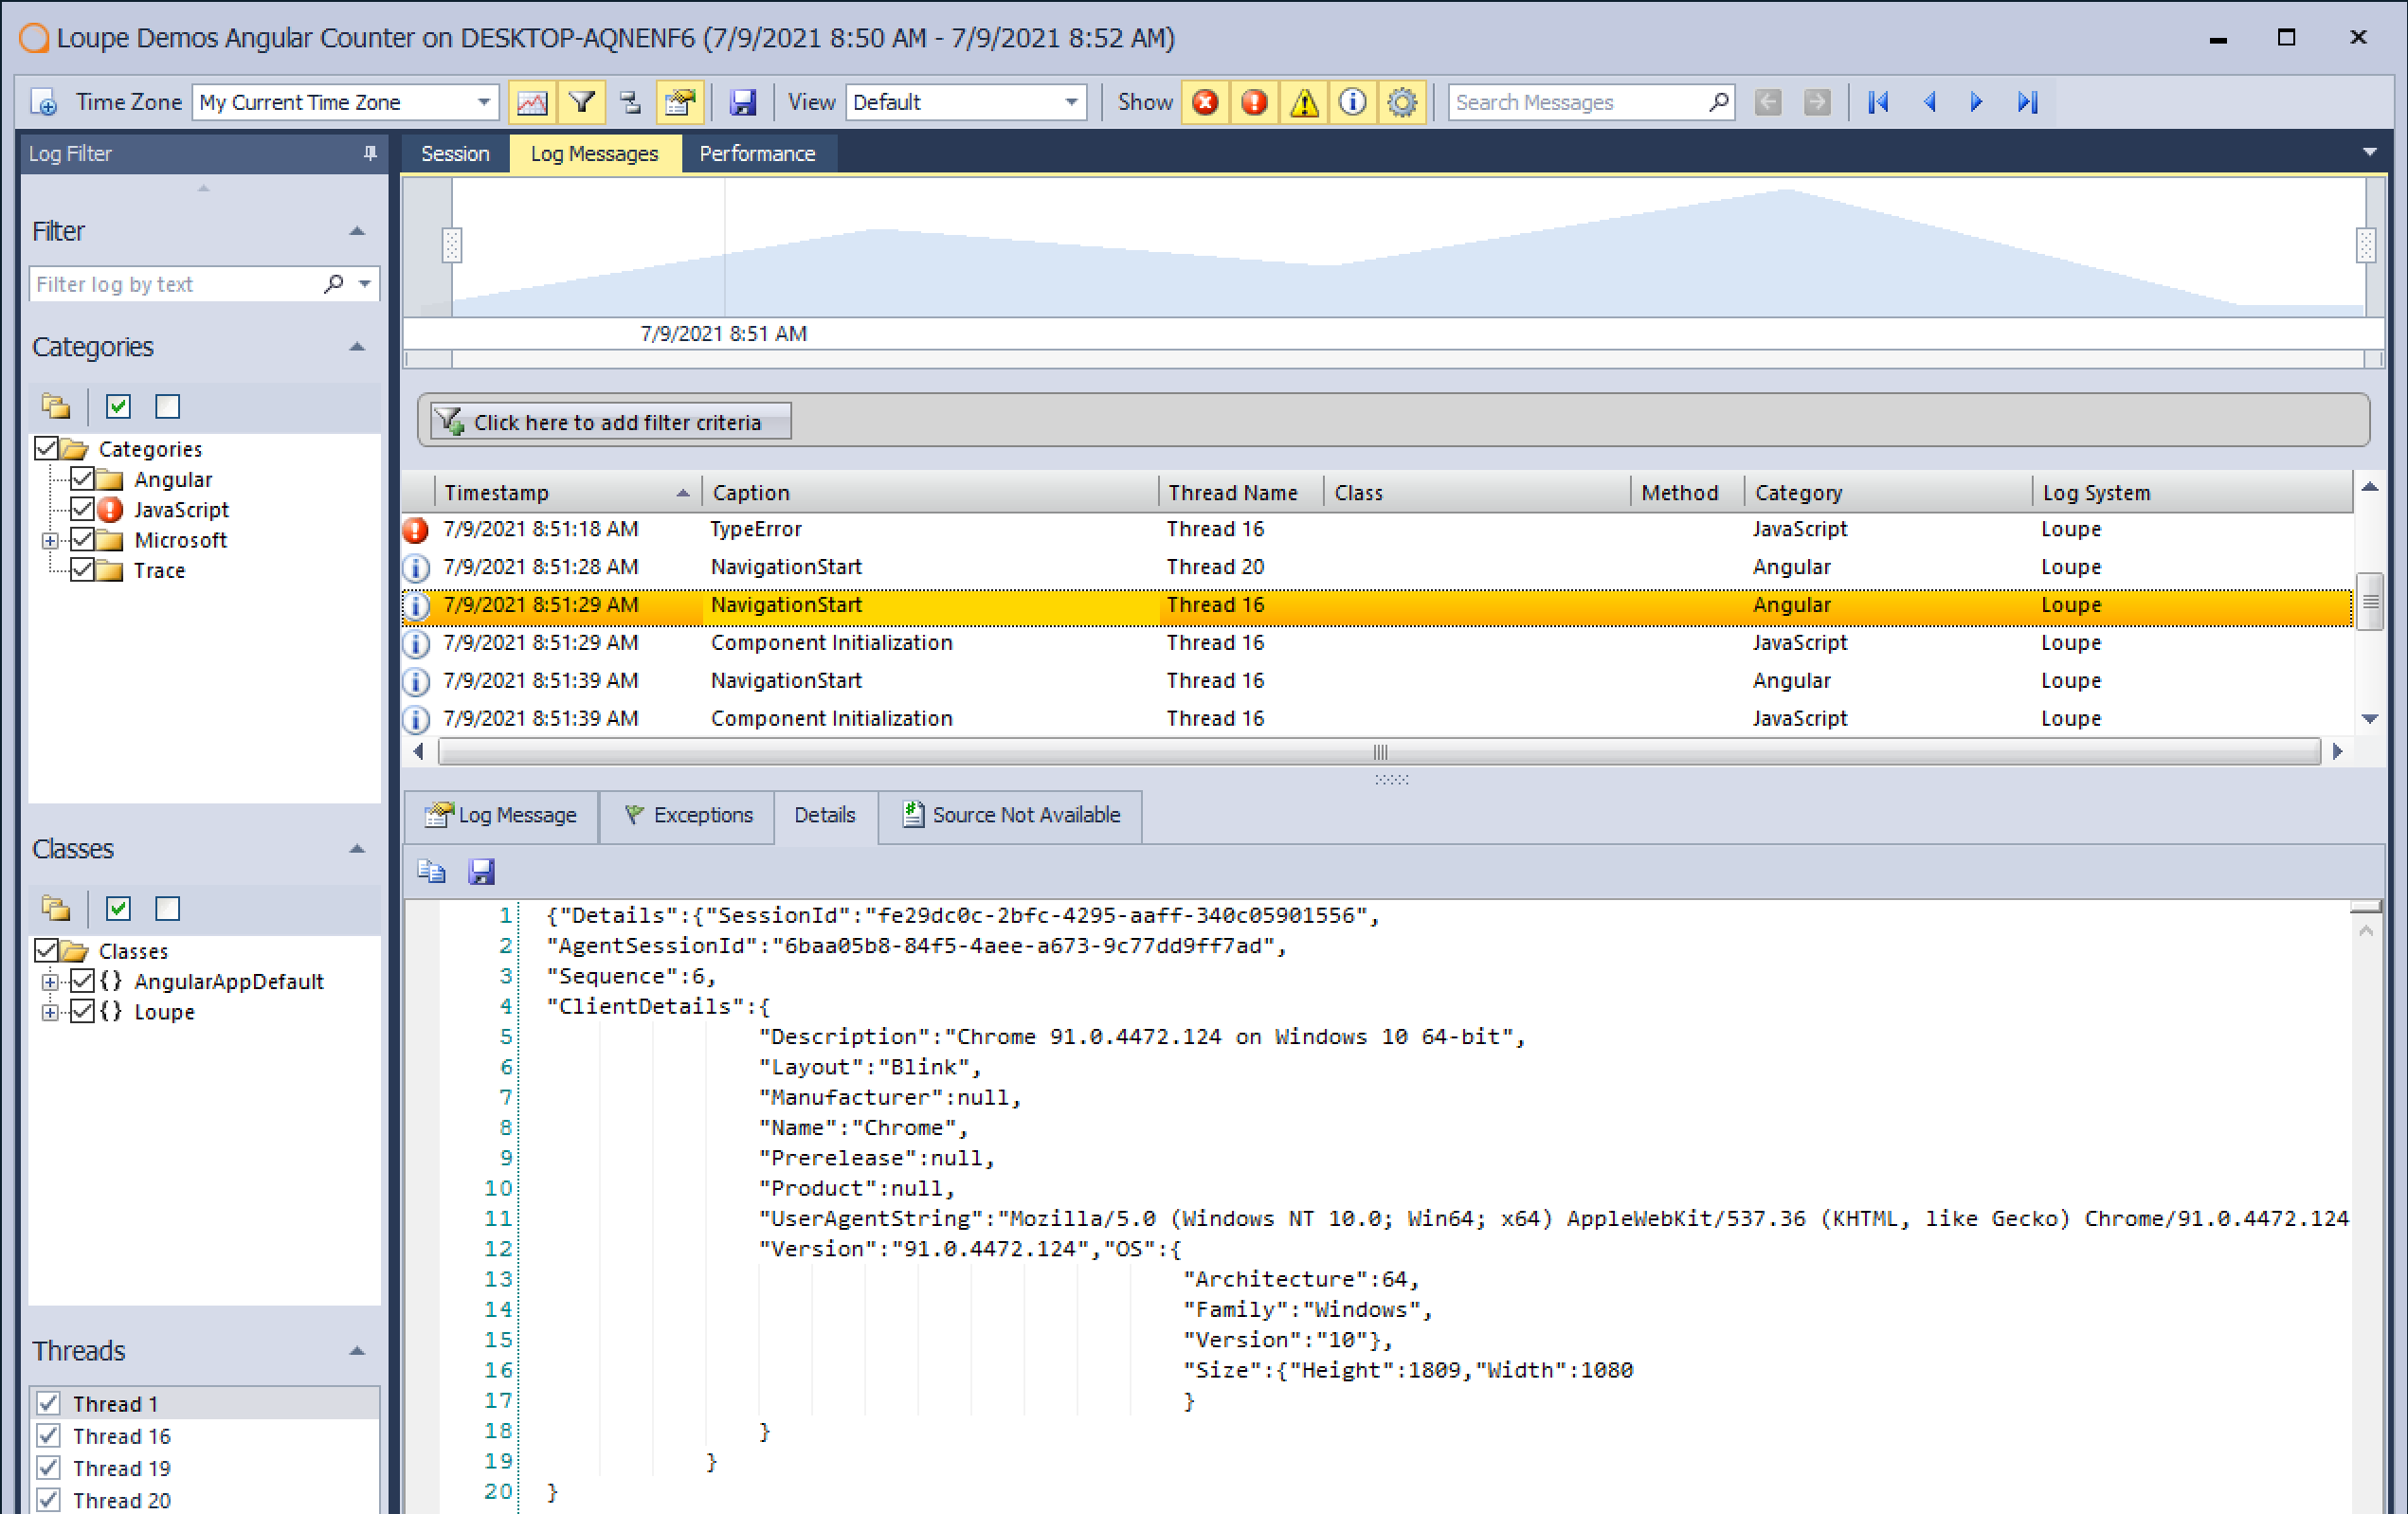
So with simple configuration along with edits to the AppComponent, you can now start piecing together what happened during a user’s session. If the user runs into an error, the most recent NavigationStart log pinpoints where in the app it took place.
Logging Navigation Events in Production
In production, it is harder to rely solely on local logging. Your app may run across multiple servers that may be difficult to access. So our recommendation for most angular apps is to adopt centralized logging as well, in this case, Loupe Server.
Largely, the setup is the same. Just a couple more lines added to the appsettings.json to specify your Loupe repo.
{
  "Logging": {
    "IncludeScopes": false,
    "LogLevel": {
      "Default": "Warning"
    }
  },
  "Loupe": {
    "Publisher": {
      "ProductName": "Your Product",
      "ApplicationName": "Your Application",
      "ApplicationType": "AspNet",
      "ApplicationVersionNumber": "1.0.1"
    },
    "Server": {
      "UseGibraltarService": true,
      "CustomerName": "Your Loupe Service Name",
      "AutoSendSessions": true,
      "SendAllApplications": true
    }
  }
}
With the Loupe repo set up, all the navigation event logs and other angular and .NET logs are available on any computer with a browser. This way, no matter where I am, I have access to the log records for my application, including navigation events for better context.
Want to Know More About Your Application?
Loupe’s Angular agent doesn’t just allow you to log navigation events but also Angular errors that are typically locked away in the browser console. Instead of relying on user reports and trying to reproduce errors locally, you can be notified of errors as they happen, know the context for them, and solve them before they’re a widespread problem.
If you have an Angular application on ASP.NET that requires client-side, centralized logging, try out our angular agent along with our free trial of Loupe Server in the link below.