New to Loupe Server? Give Loupe Desktop a Spin Too.
Loupe Server is excellent for easy centralized logging, allowing you to access your log data on any machine that can run a browser. But many developers prefer to use dedicated desktop applications, especially when troubleshooting an issue. For them, we have Loupe Desktop: a free log viewer for .NET and JAVA developers who need to go deeper into local or remote log data.
Here we will discuss the basics for setting up Loupe Desktop and review the unique features we made for desktop users.
How to Get Loupe Desktop For Yourself
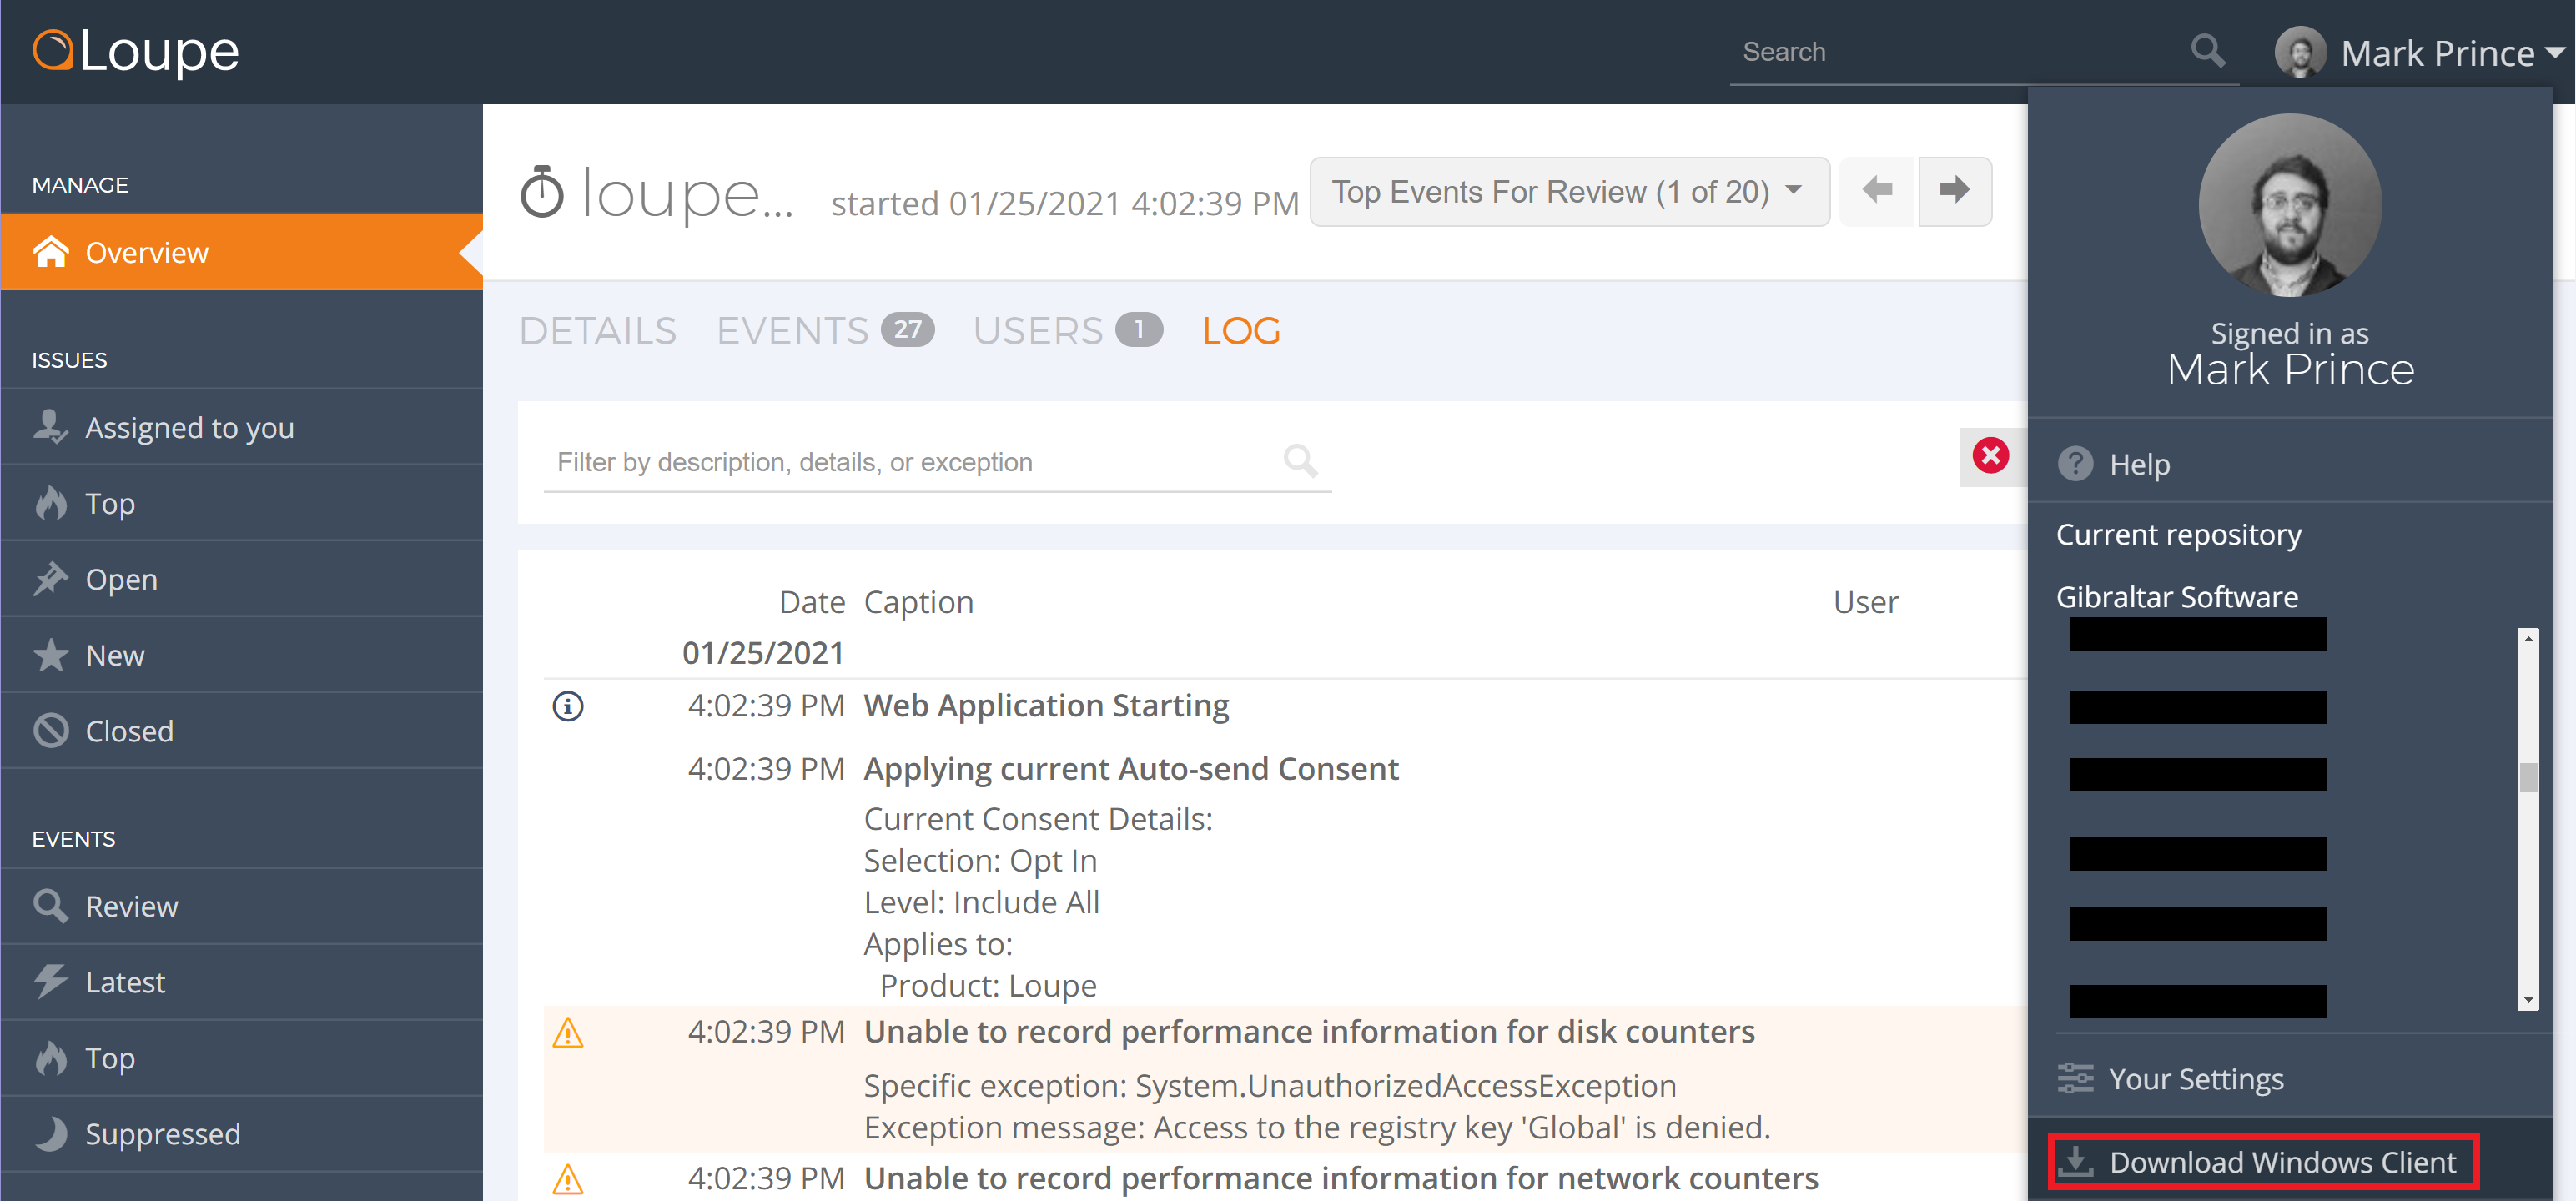
If you’re already a Loupe Server user, installing Loupe Desktop is easy! Simply open Loupe Server in your browser, open the user menu, and click on the “Download Windows Client” button. I’ll admit that I missed this button when trying to install Loupe Desktop for the first time… But now that I have told you where to look, you can avoid making the same mistake yourself.
There is an additional way to download Loupe Desktop: on our dedicated download page. Even if you are not a Loupe Server user, you can access Loupe Desktop for free and use it as an advanced log viewer for any .NET or JAVA projects. If you are a Loupe Server user though, you can quickly set up Loupe Desktop to view the same log data by linking the service.
Link Loupe Desktop with your Loupe Server Services
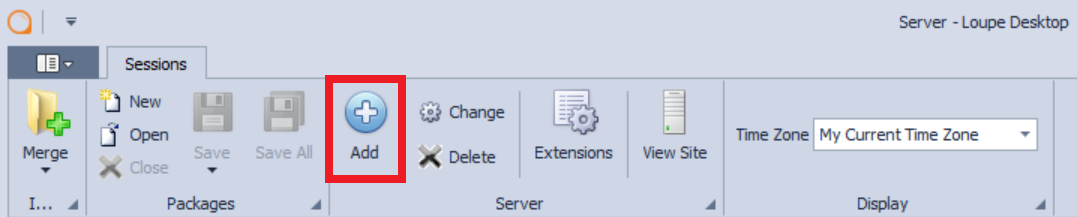
To start the process, press the “Add” button in the top bar of the Loupe Desktop application which opens the “Loupe Server Connection Wizard.”
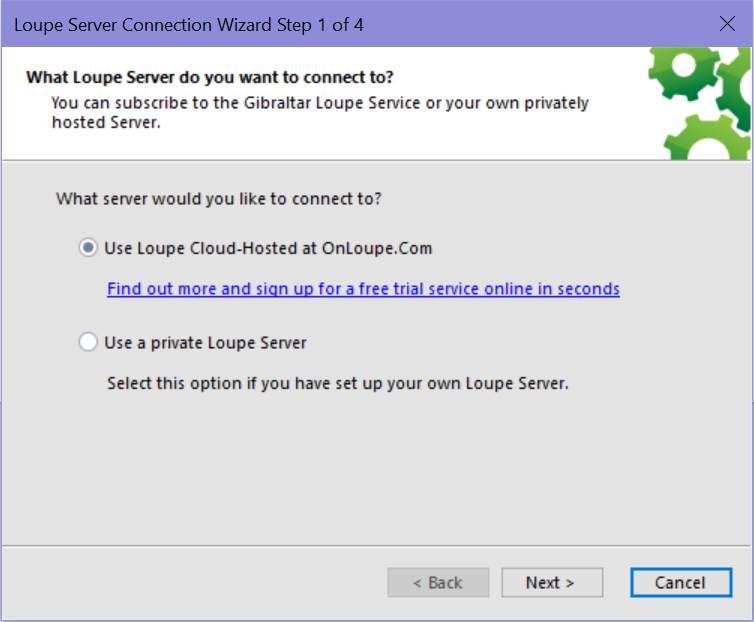
On the first step, there are two options you can select from: “Use Loupe Cloud-Hosted at OnLoupe.com” or “Use a private Loupe Server.” Users who don’t privately host their own instance of Loupe Server will choose the first option and move on to step two.
Next, you need to enter your service name. If you are already a Loupe Server customer or started a trial, you have created a service during the initial signup.
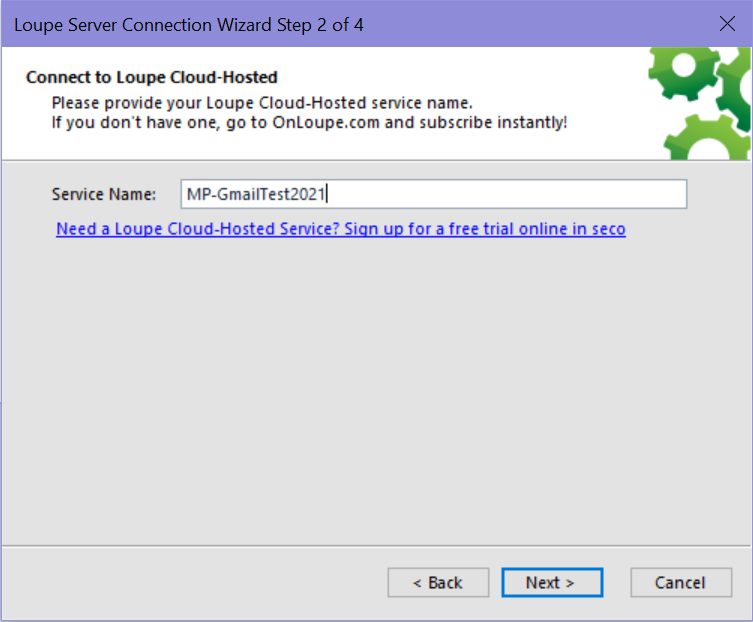
When I was first setting up Loupe Desktop, I forgot my service’s name. A quick way to find your service name is to open it in Loupe Server and look at the URL. Your service name will be the last section of the URL path.

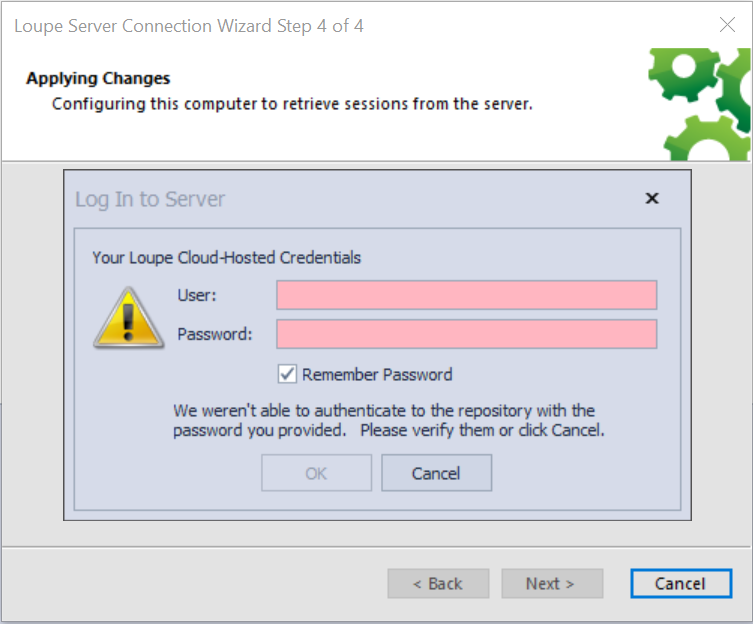
Finally, once you put in the service name, Loupe will ask for your account credentials. Simply put in your name and password, and Loupe Desktop will have access to the service.
Once you have your service connected to Loupe Desktop, you can really start digging into the program.
What’s Different About Loupe Desktop?
The main difference is that Loupe Desktop has been optimized not only for viewing services but also for local log viewing. In some development environments, you don’t necessarily want centralized logging for organizational or security reasons. There are also scenarios where you may not have internet access but still want a great local log viewer.
These are obvious situations where you would use Loupe Desktop, but there are plenty of uses outside of these scenarios. Many Loupe Server users open up Loupe Desktop when in the middle of troubleshooting because of the following features:
Detail-Forward Interface
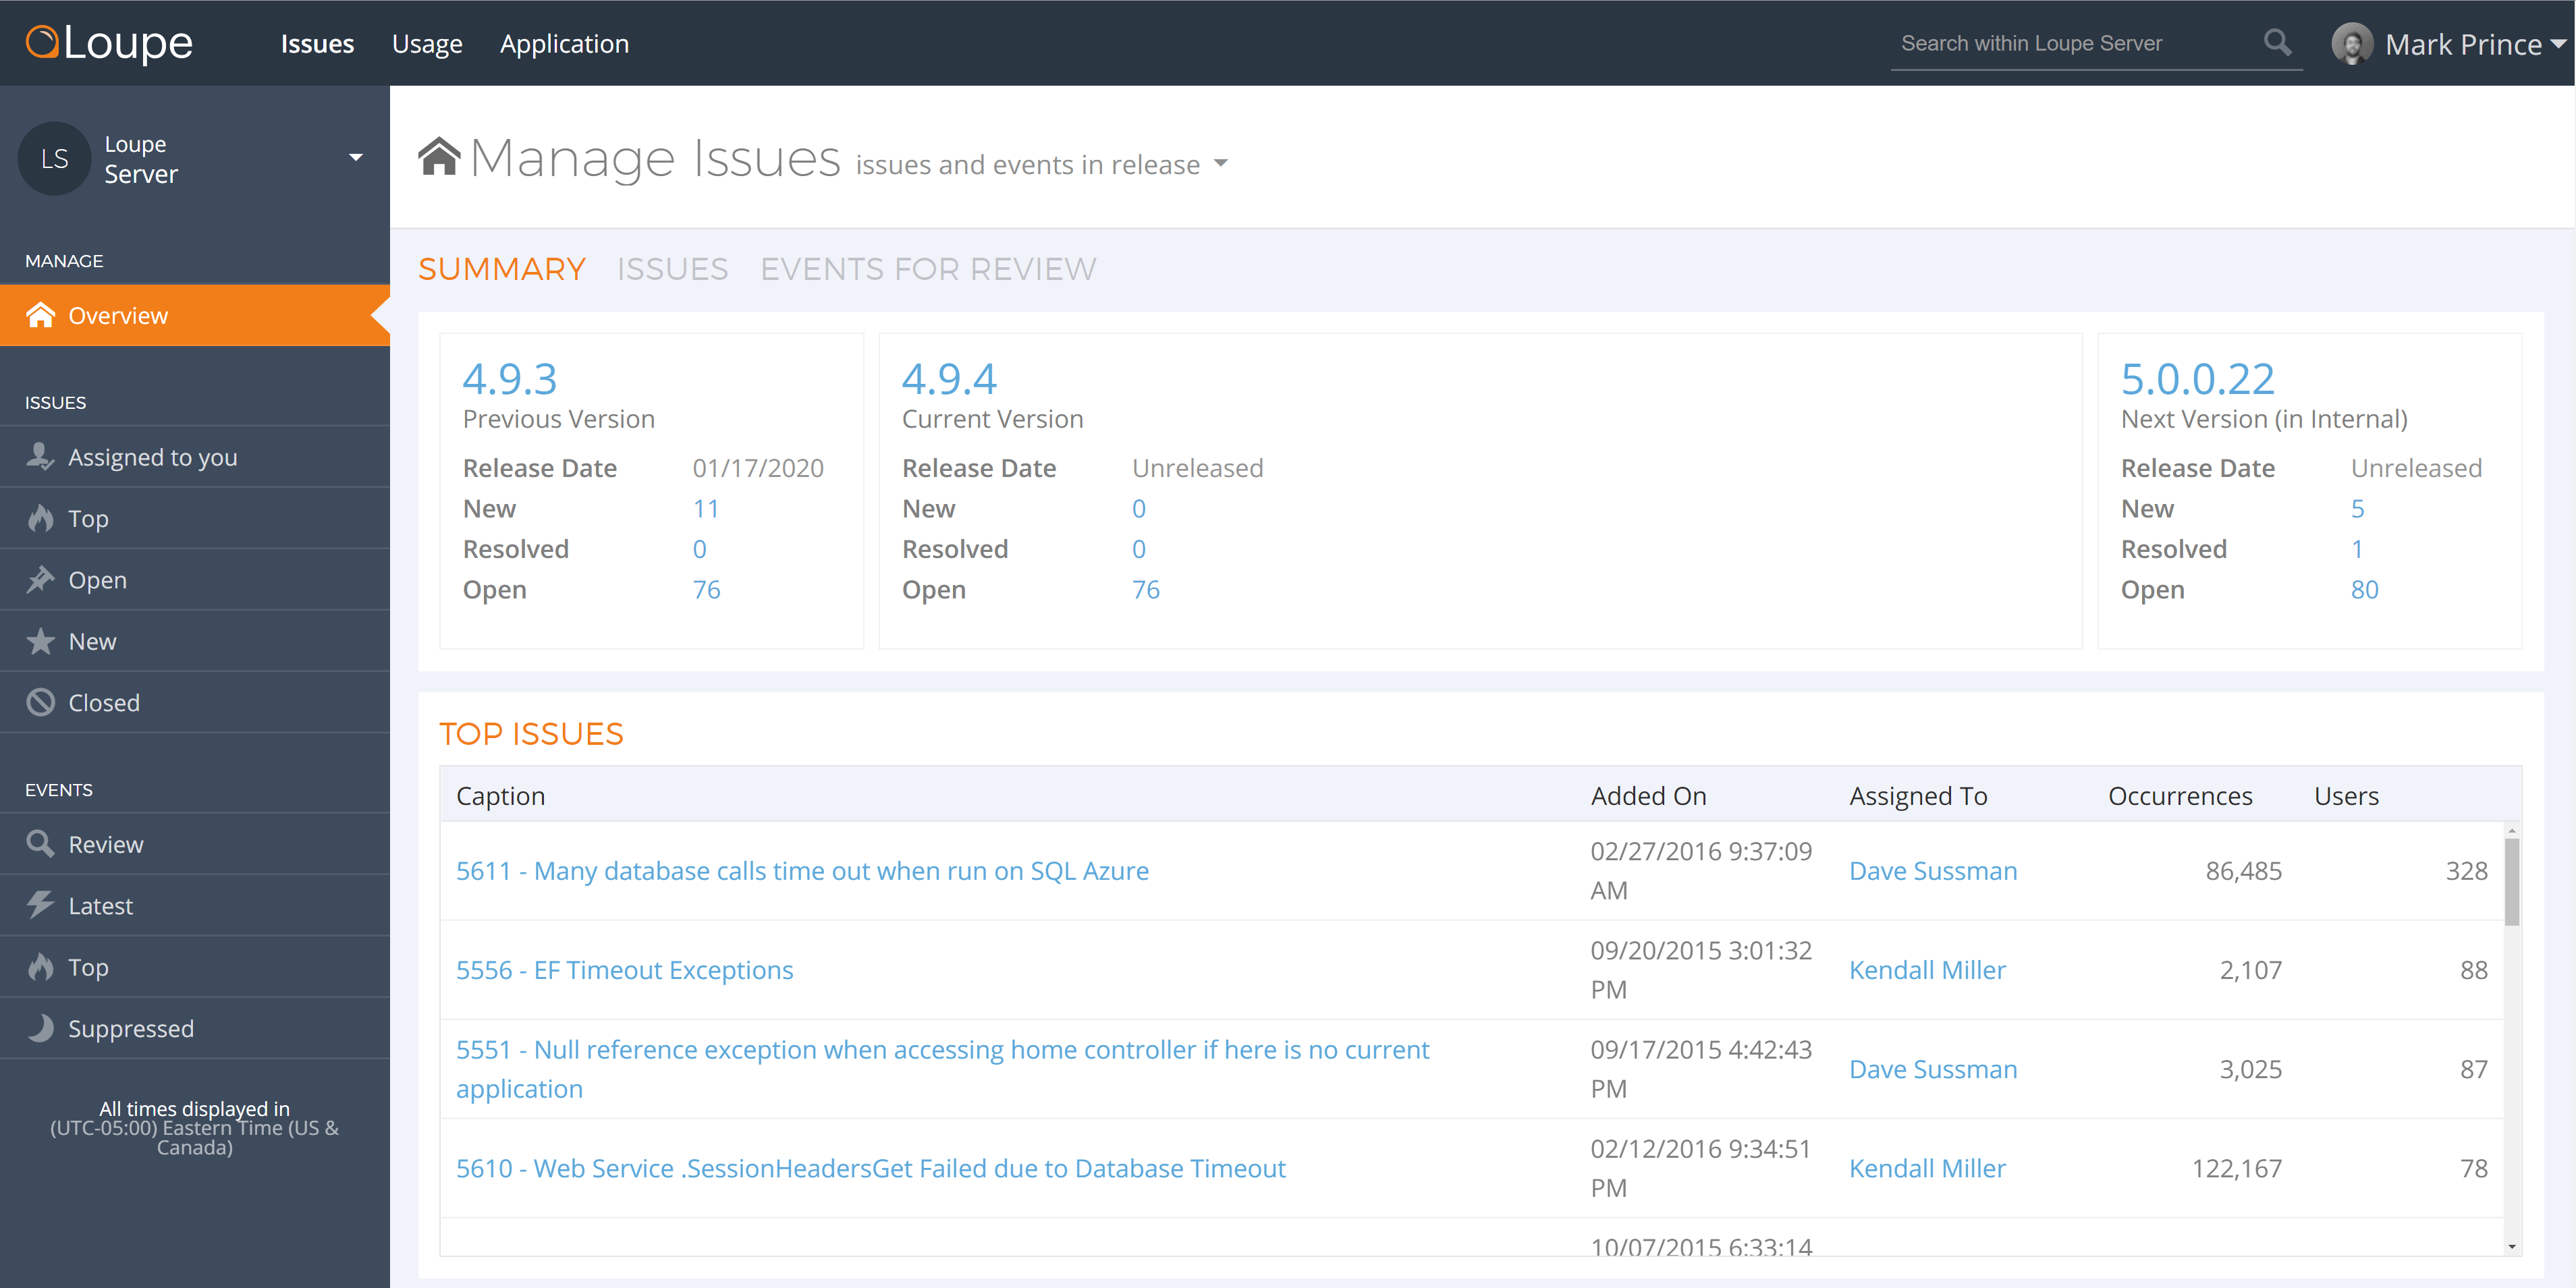
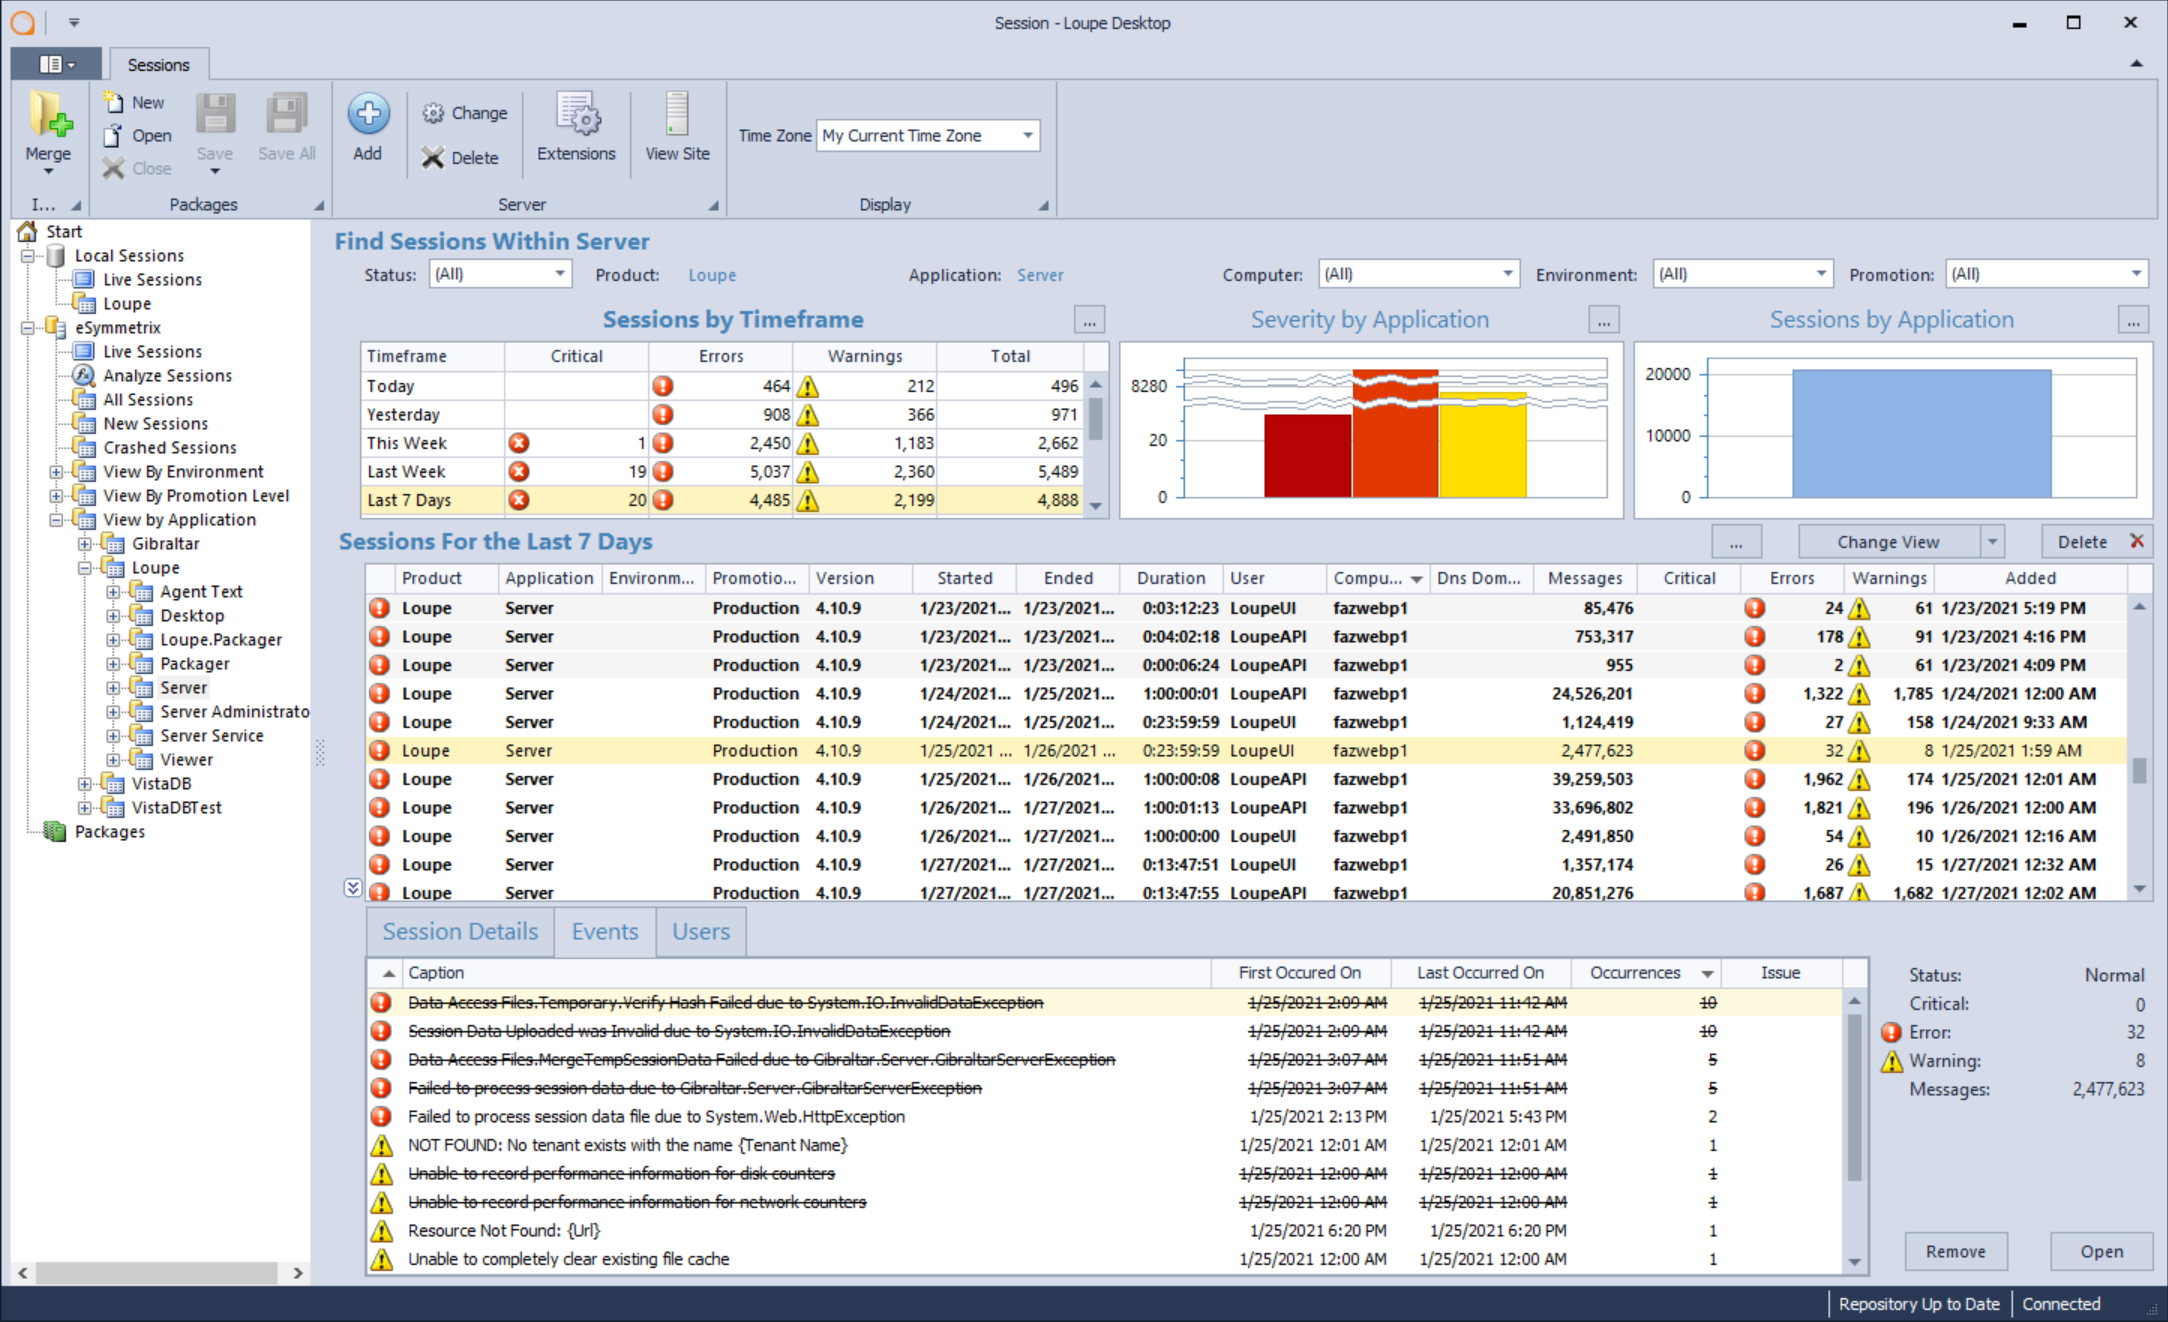
Above I have a screenshot of both Loupe Server and Loupe Desktop. In both versions of Loupe, I navigated to the default landing page for an individual service. It’s a good example of what is valued by both interfaces. The Loupe Server page is instantly navigable and shows you the top issues and events for your applications. It’s fantastic for finding the most important, most widespread problems with your application quickly and see who’s responsible for resolving them.
Loupe Desktop, on the other hand, is busier but more detailed. The service page prioritizes information on overall service health and letting you quickly dive into individual sessions.
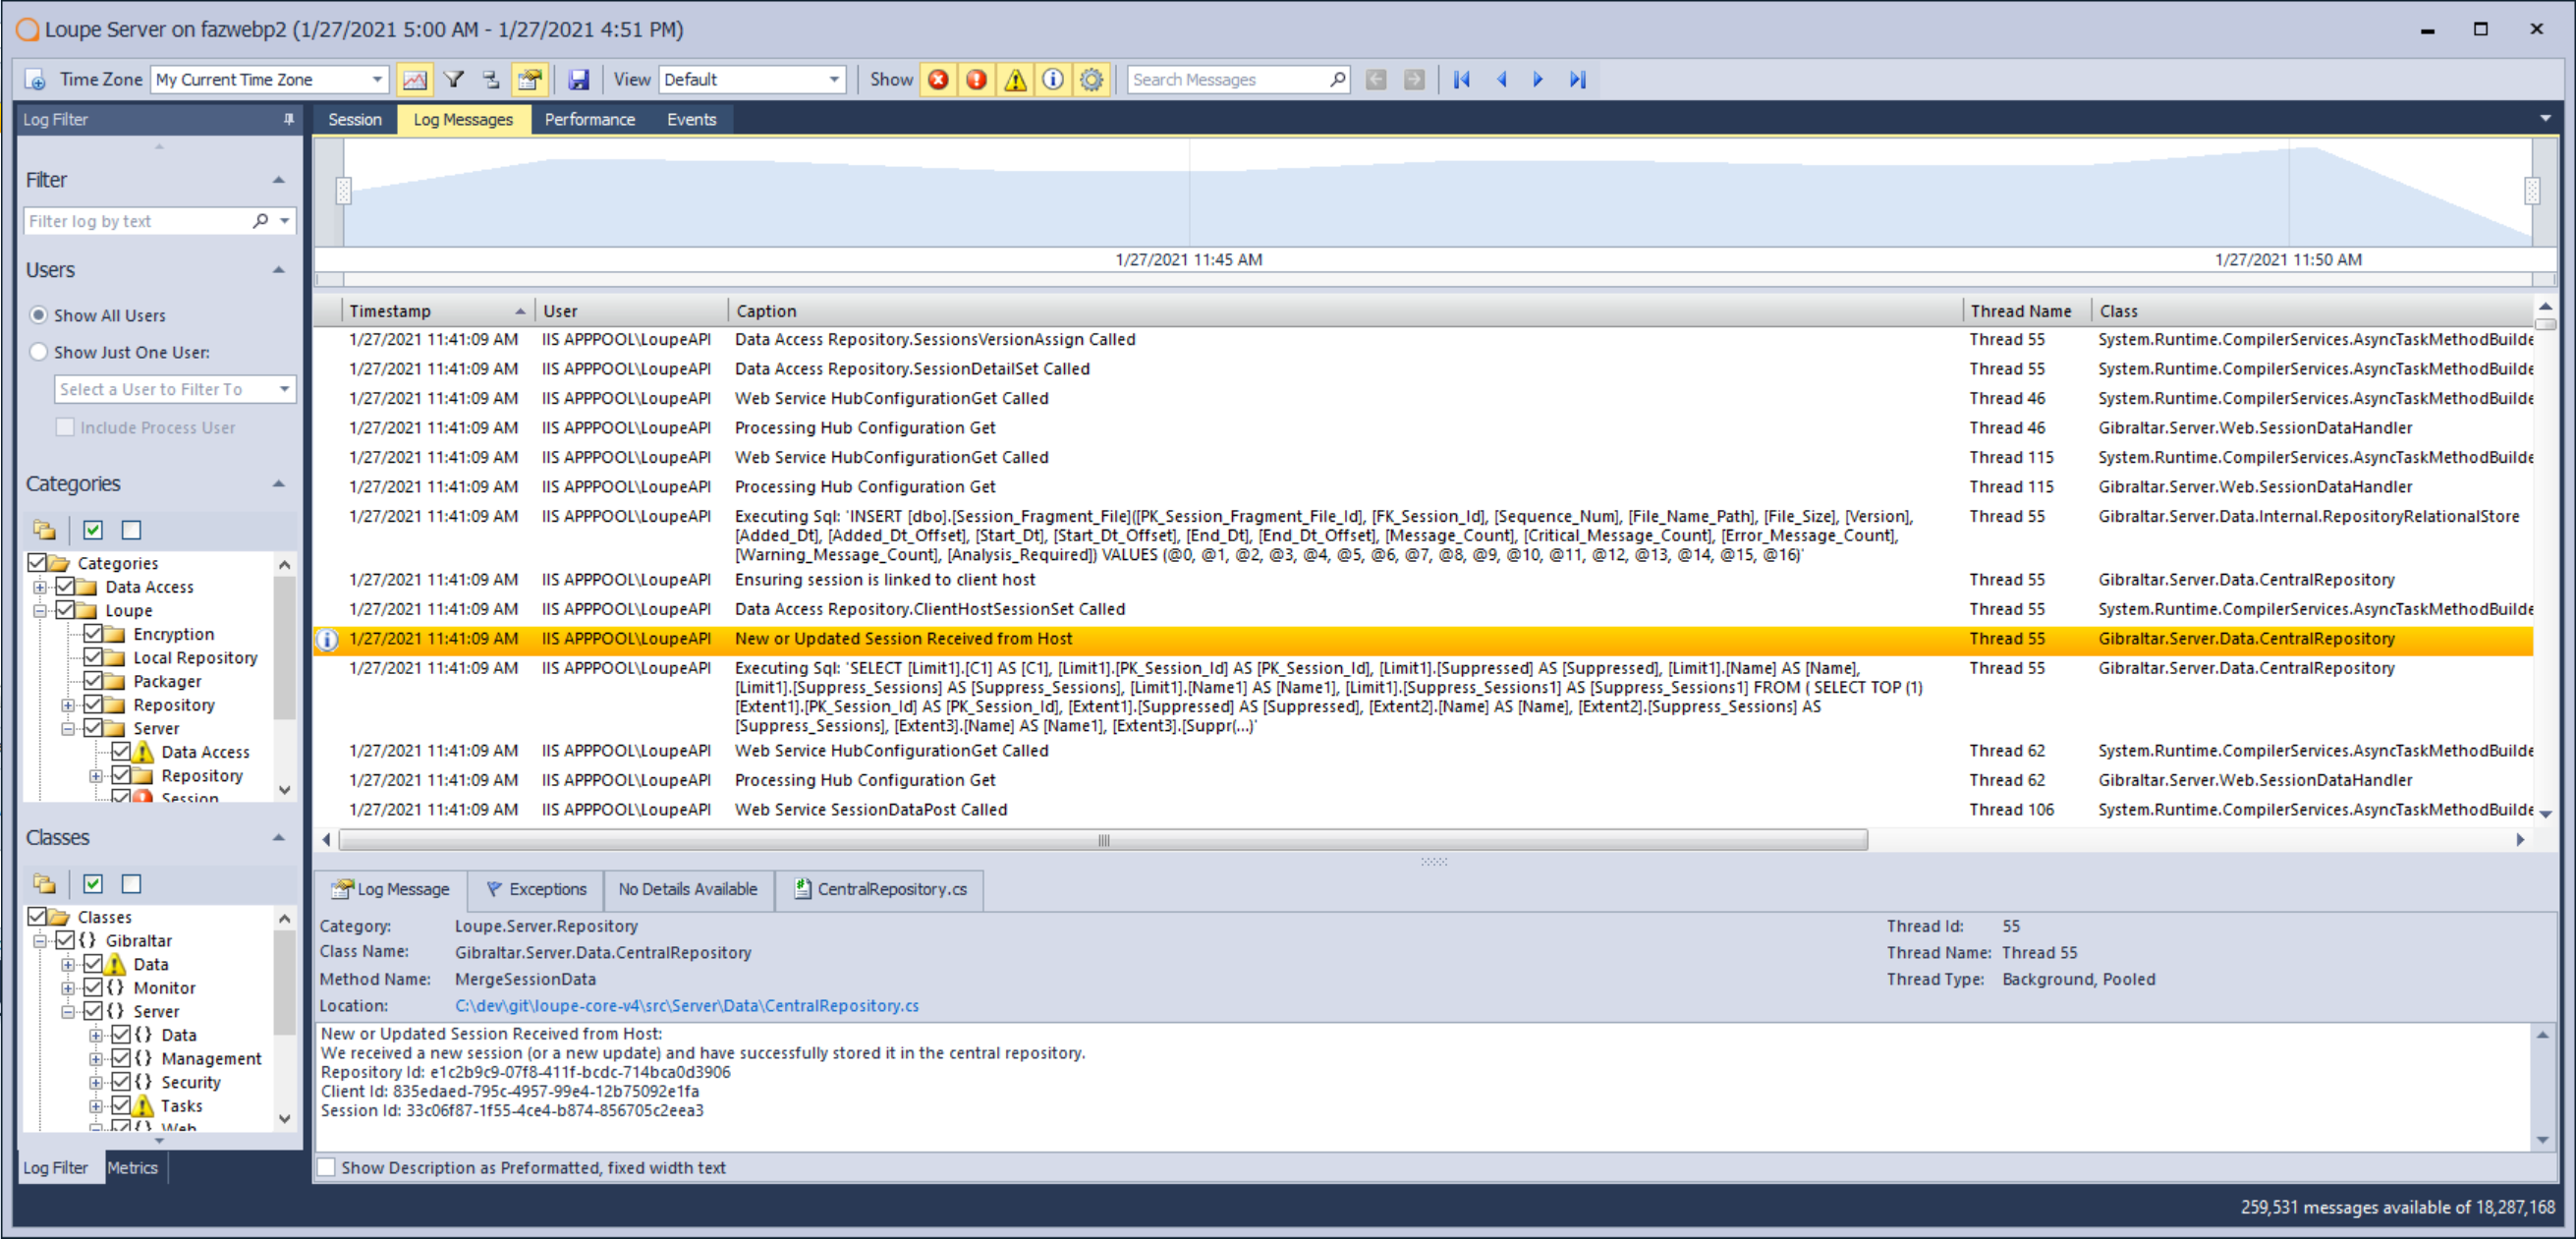
If we drill down into an individual session, we can easily navigate all the log data in the Log Messages view. While I can of course view log data in Loupe Server, on Loupe Desktop I can easily view log frequency over time, sort logs by classes, and use the performance view.
Performance View for Sessions
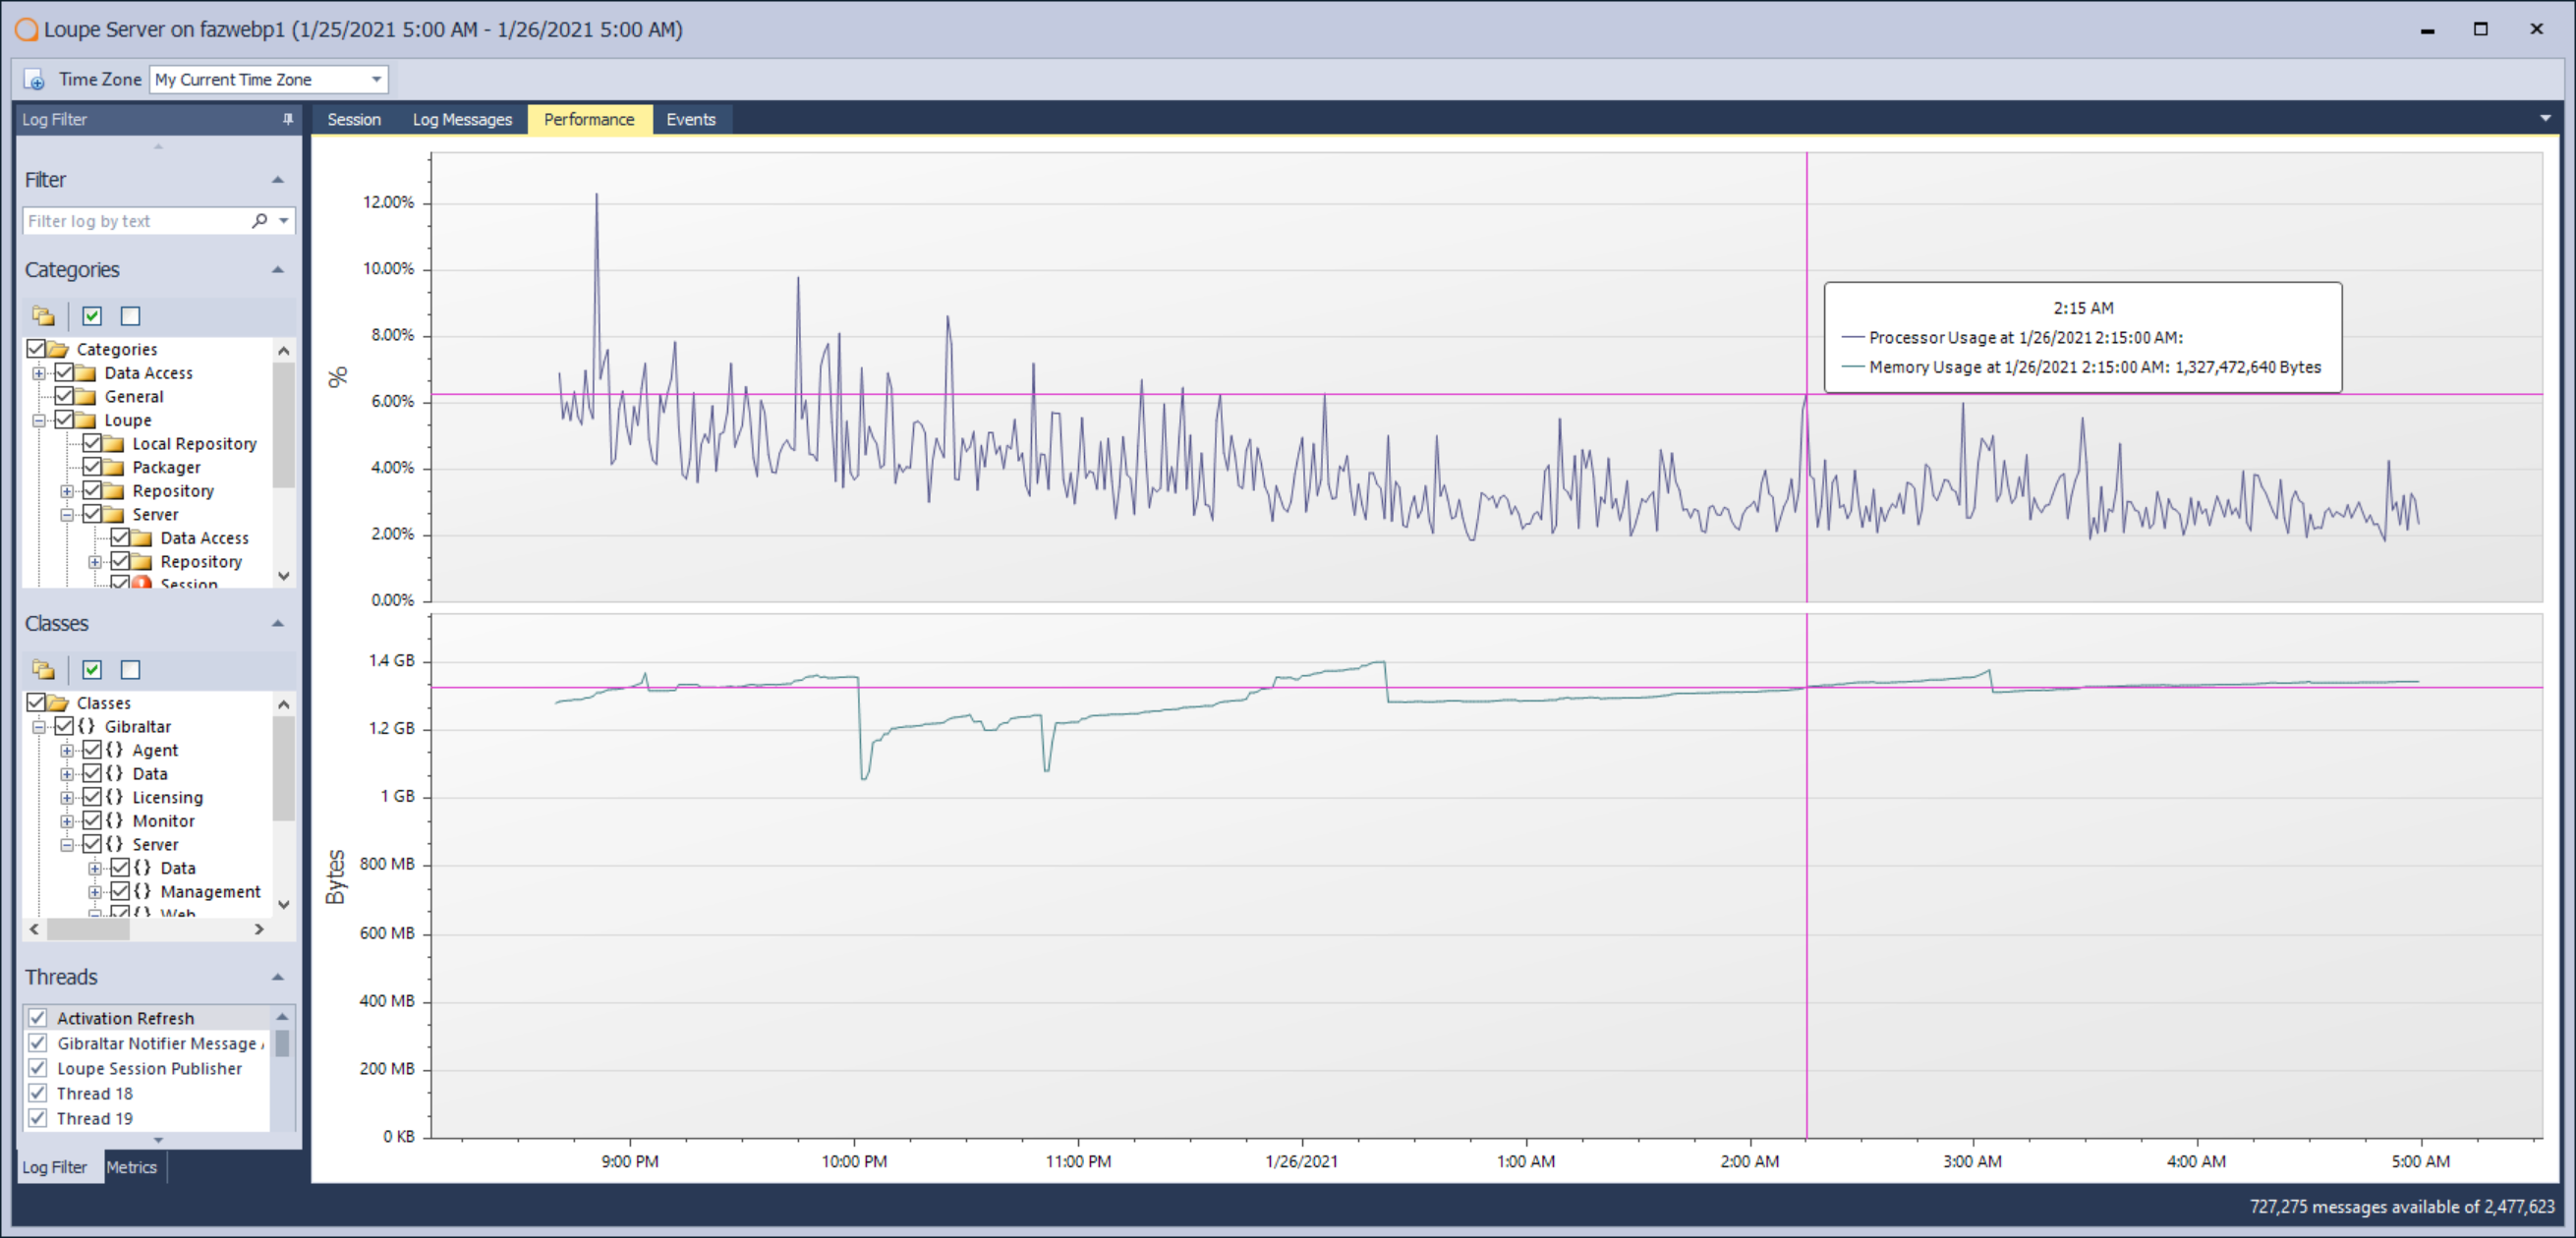
Performance View is a unique feature for Loupe Desktop. With the performance view, you can view processor, memory, and disk usage for a machine throughout the session. Additionally, Loupe tracks inbound and outbound network usage as well. You can learn more about the exact metrics Loupe collects in our documentation.
Live Session View
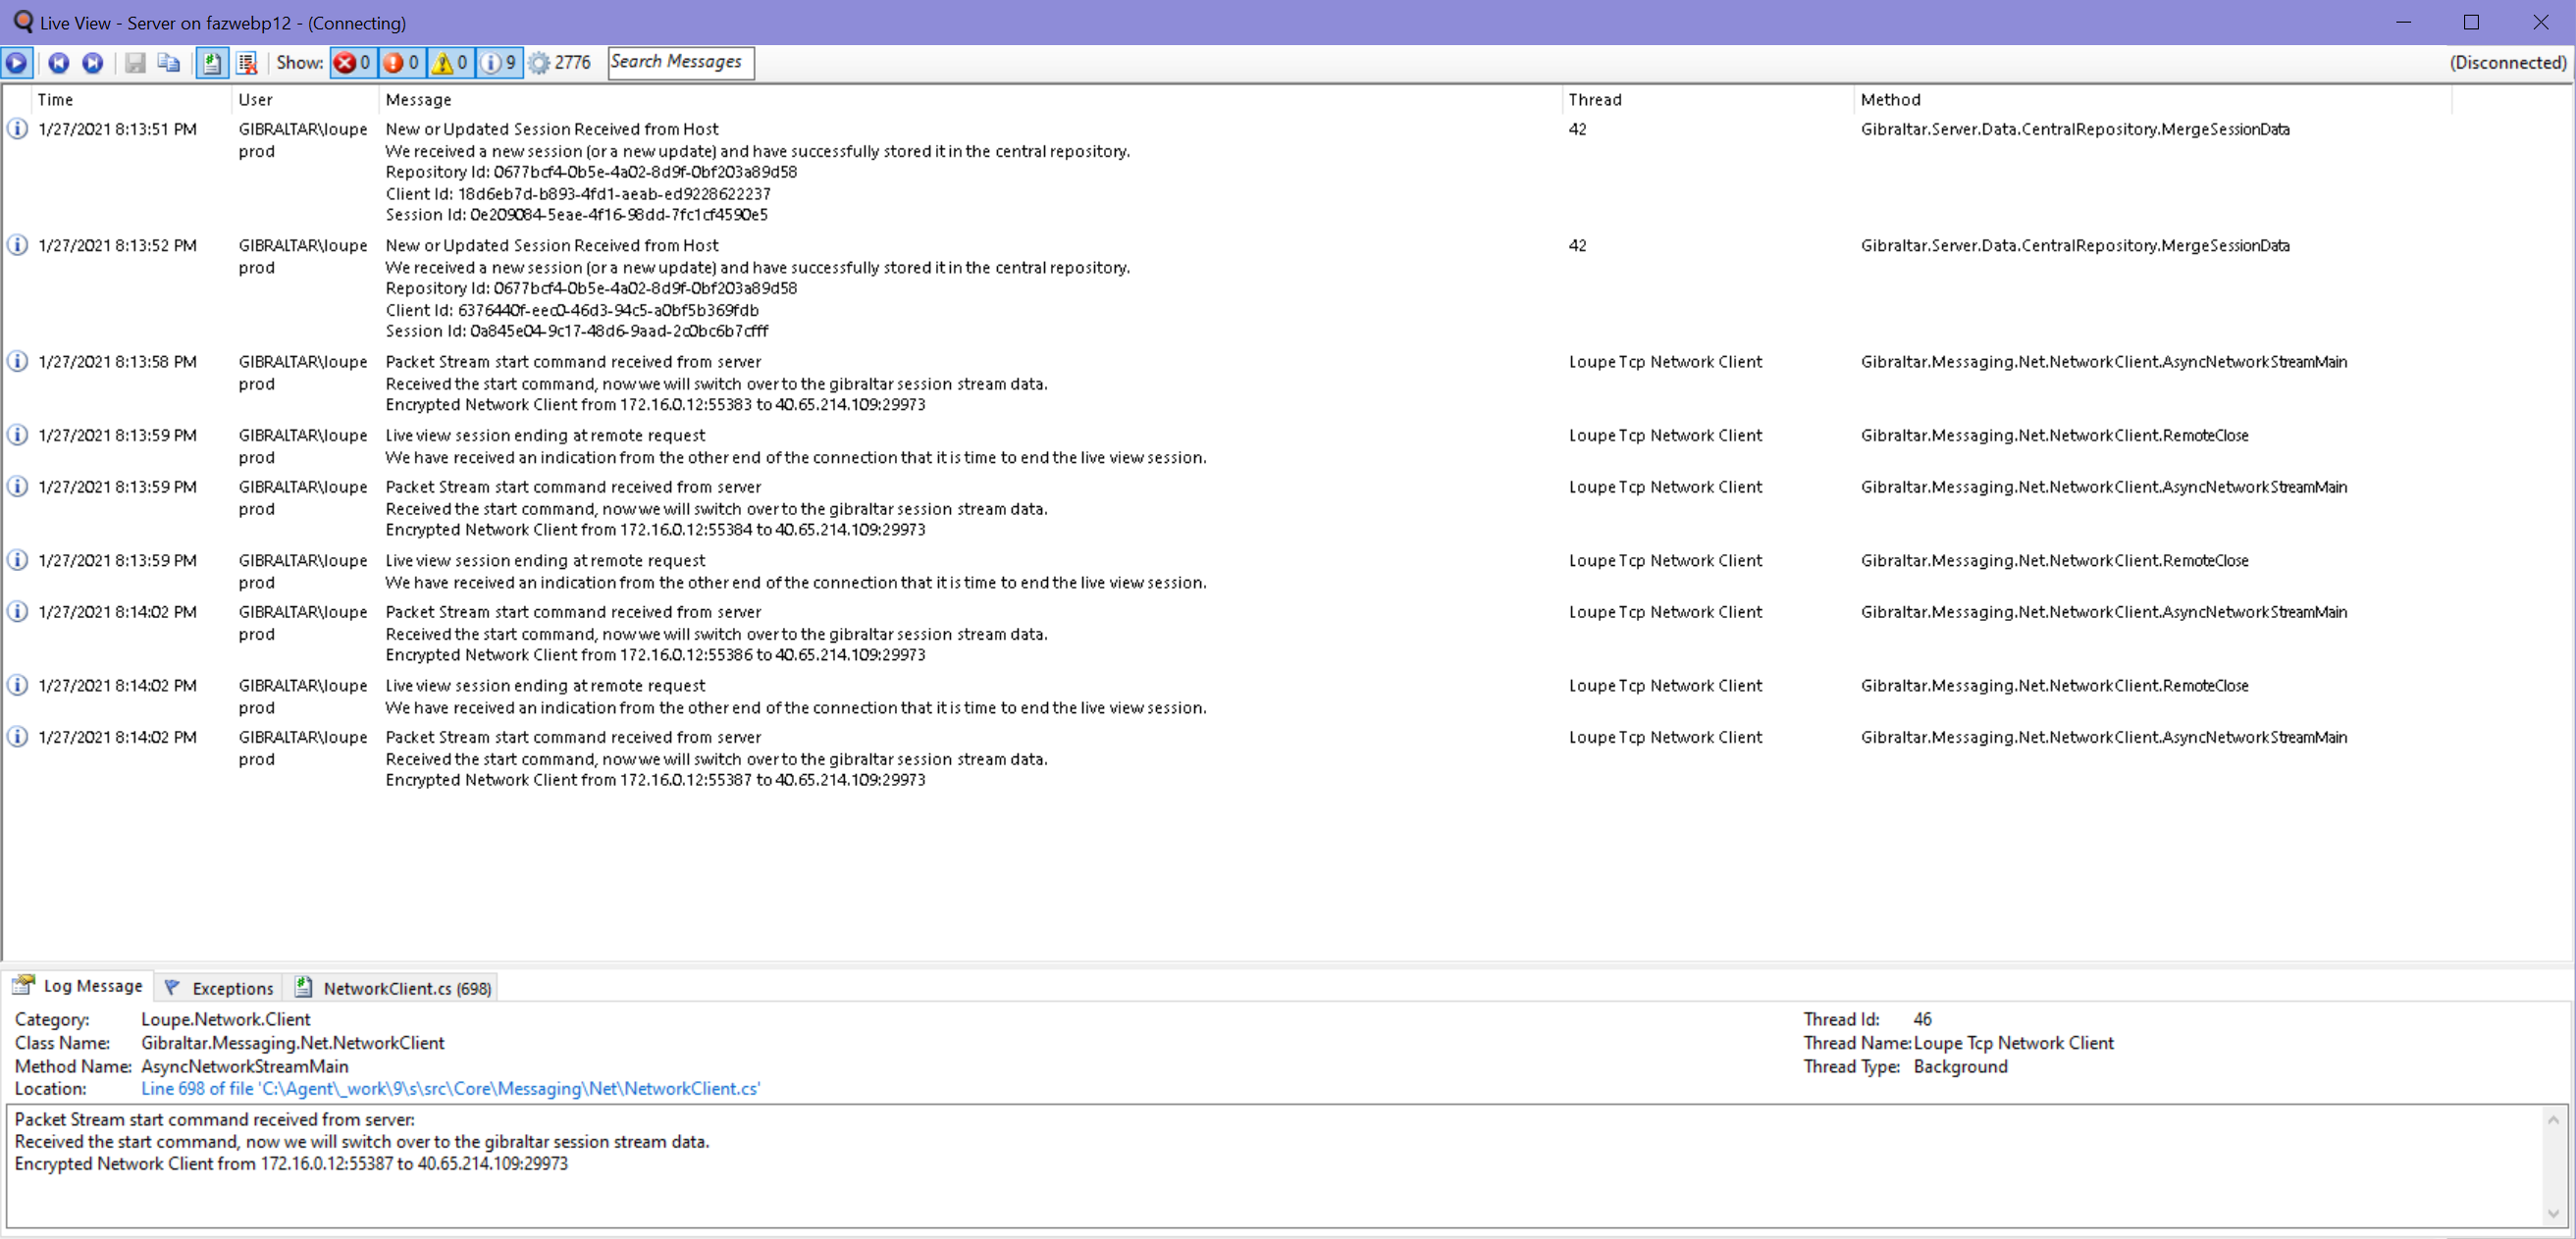
Another feature Loupe users have found useful when troubleshooting is the live session view. This view allows you to follow the log data trail of a session in real-time.
This view can get overwhelming, as many applications create a ton of log data. To help keep the flood at bay, make sure you know the controls as shown below:

As with the rest of the Loupe platform, you can filter your feed to only show specific types of logs (errors, warnings, information, etc.). In the control bar shown above, we can see over 6,000 “verbose” messages in our live feed. Going through that to find the one error message in the bunch can be a pain. If it turns out I need to see those messages later, I can always turn them back on.
The control bar also has a pause, back, and forward button. Pause will stop the live feed from updating, back will send you to the first message of the session, and forward will send you to the most recent message in the session.
That should give you a decent start for controlling the live session viewer. Any control in the Loupe Desktop interface will give you a description on hover, so it doesn’t have to be difficult to figure out as you go.
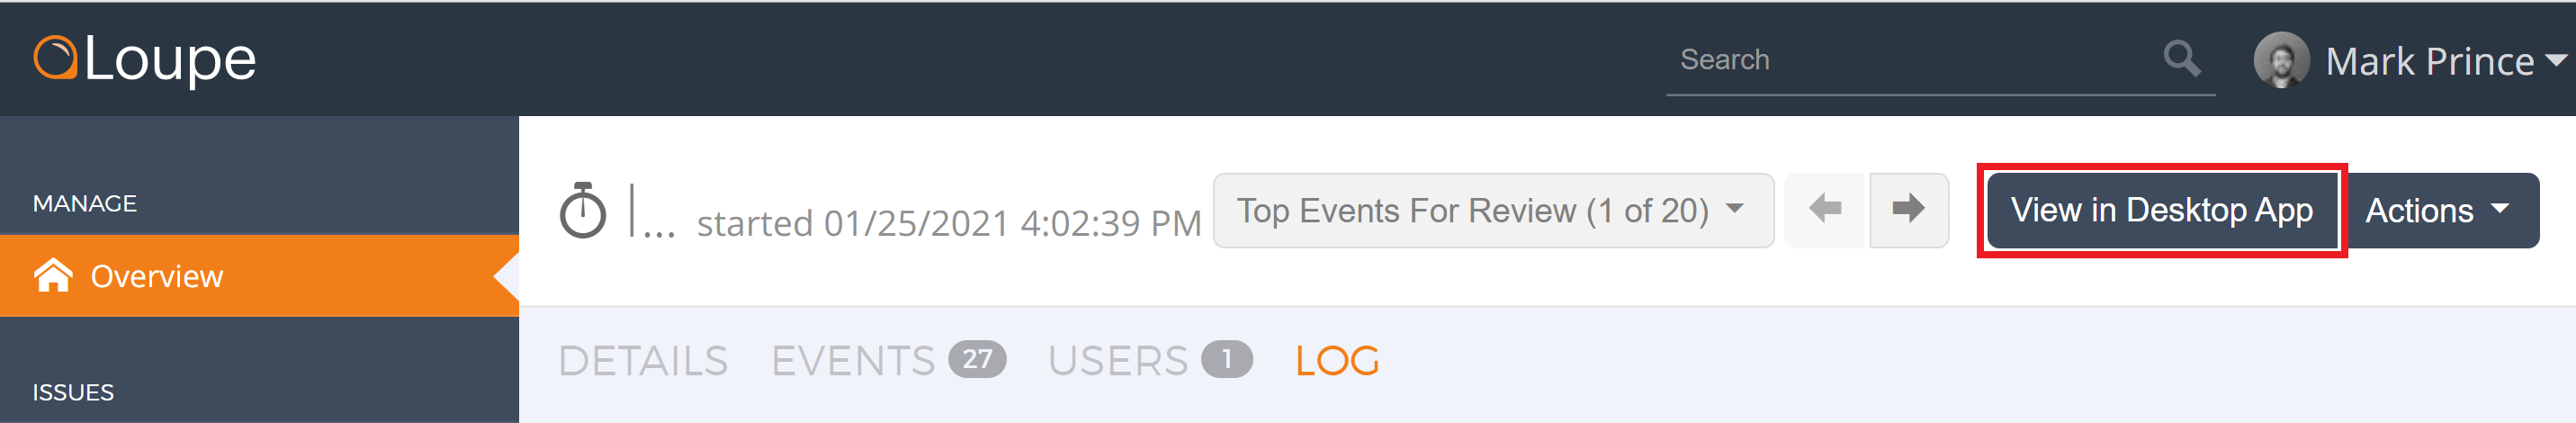
Loupe Server and Loupe Desktop Make a Great Team
If I am using Loupe Server and want to view a session with Loupe Desktop, that’s no problem. On top of the session view, there is a button labeled “View in Desktop App.” Simply click the button, allow the browser to open Loupe Desktop, and the session will start loading.
Overall, there are reasons to use both. Anyone who uses Loupe Server that wishes to dive a bit deeper into individual sessions while troubleshooting should give Loupe Desktop a shot. Even folks who don’t have Loupe Server can use Loupe Desktop as a free local log viewer for .NET and JAVA projects. So, no need to wait; give Loupe Desktop a shot today.