Effective Angular Error Logging for Production Apps
Early in an Angular project’s development, logging can be pretty straightforward. Errors are logged in the browser console and are easy to find while using the application locally. Just open up chrome dev tools, and you’ll have a decent idea of what’s going on at any given moment. But troubleshooting gets far more problematic once your application’s released and running around the globe. Without the proper preparation and toolset, errors can go unnoticed for a long time, resulting in a dissatisfactory experience for users and frustration for developers.
Luckily, some tools and techniques can make the process easier. Here, we will review why logging Angular errors in production can be difficult in the first place and what you can do to log effectively.
What makes Angular Error Logging Difficult?
Many of the obstacles involved with logging for Angular are inherited problems from Javascript. Javascript errors by default log to the browser console. It’s convenient for development, but this default behavior becomes troublesome when the application is in production. This is because errors in production still log exclusively to the user’s browser console by default, which you’ll likely never see. Therefore, the errors users find in the wild are hidden from the developers until someone lets them know. Then developers are in a situation where they have to recreate an error based on often incomplete information, and hope the problem isn’t too widespread.
Plus, even if Angular’s logging difficulties stem from larger problems with Javascript, they are often made worse due to the structure of many Angular applications. Specifically, Angular’s used to create Single Page Applications, which can be a nightmare to log effectively:
-
Angular apps tend to lean heavily on client-side scripting, especially Single Page Applications. In general, less activity occurs on the server-side, where you can keep tabs on it. So, more error logs get stuck in the user’s browser console, where you won’t see them.
-
Not all traditional logging and tracking plays well with a single page structure. If you don’t log carefully, you’ll have trouble knowing where in the application the error occurred, meaning the user’s view. For some errors context matters, and are more difficult to fix without it.
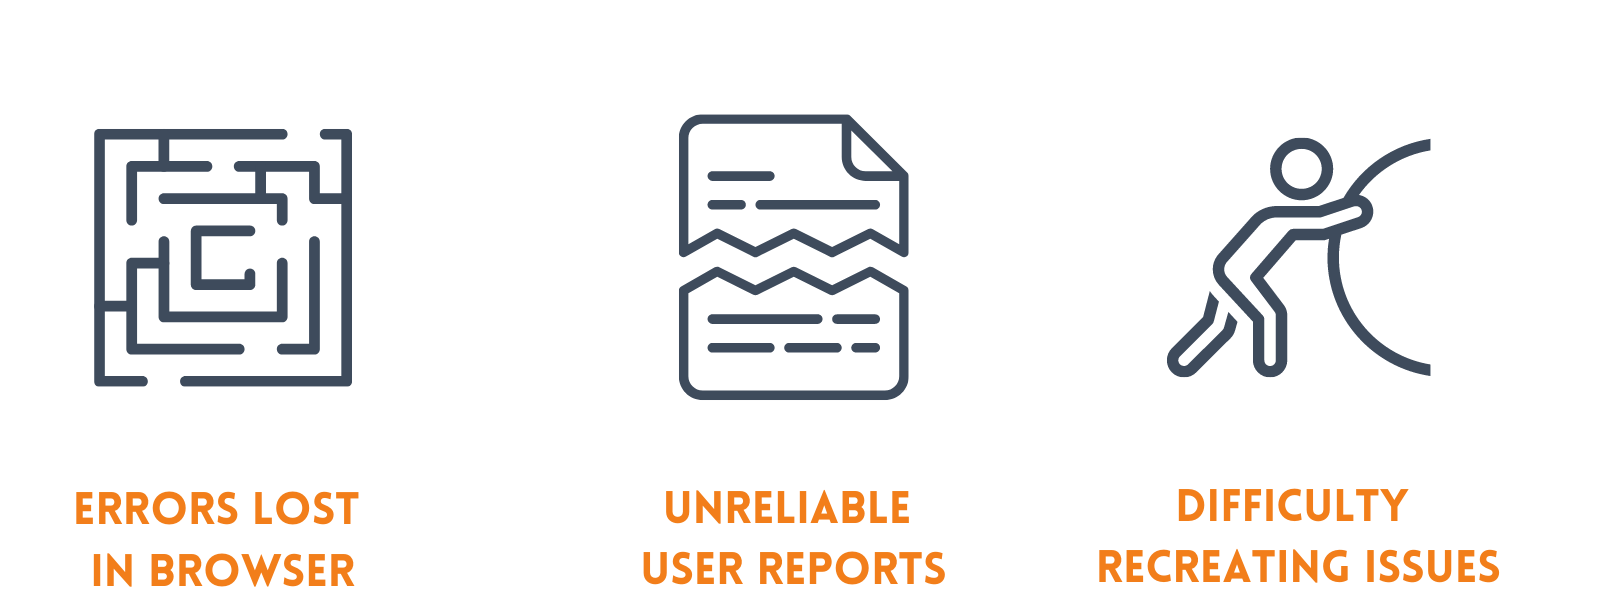
Overall, Angular error logging suffers from its default log sink’s temporary nature and problems with getting the necessary context for an error. Production problems may end up relying on user reports which are not always reliable. Users may struggle to find the information needed, like browser version, order of actions taken, machine specs, etc., making troubleshooting harder. Recreating errors isn’t easy under reasonable circumstances and worse with missing information. And more often than not, the user won’t even tell you about the error; they will stop using the application.
So, how do you improve the situation?
Logging Angular Errors Effectively
Broadly, there are three requirements for effective production logging:
- You can access logs reliably and quickly.
- Logs contain the information needed for troubleshooting.
- You have a mechanism to learn when an error occurs.
Together, these requirements ensure you can fix errors as they happen with minimal time spent trying to piece together what happened. It’s worth noting that these requirements are not unique to logging for Angular applications, just harder to fulfill. So traditional logging methods need to be set aside for the techniques used at the cutting edge. Let’s go into detail on what it takes to log an Angular application properly.
Adopt Client-side, Centralized Logging
Client-side, centralized logging is a bunch of buzz words, but not for no reason. Using both is necessary to log errors reliably, as both pieces together ensure everything required is logged and you can access the logs.
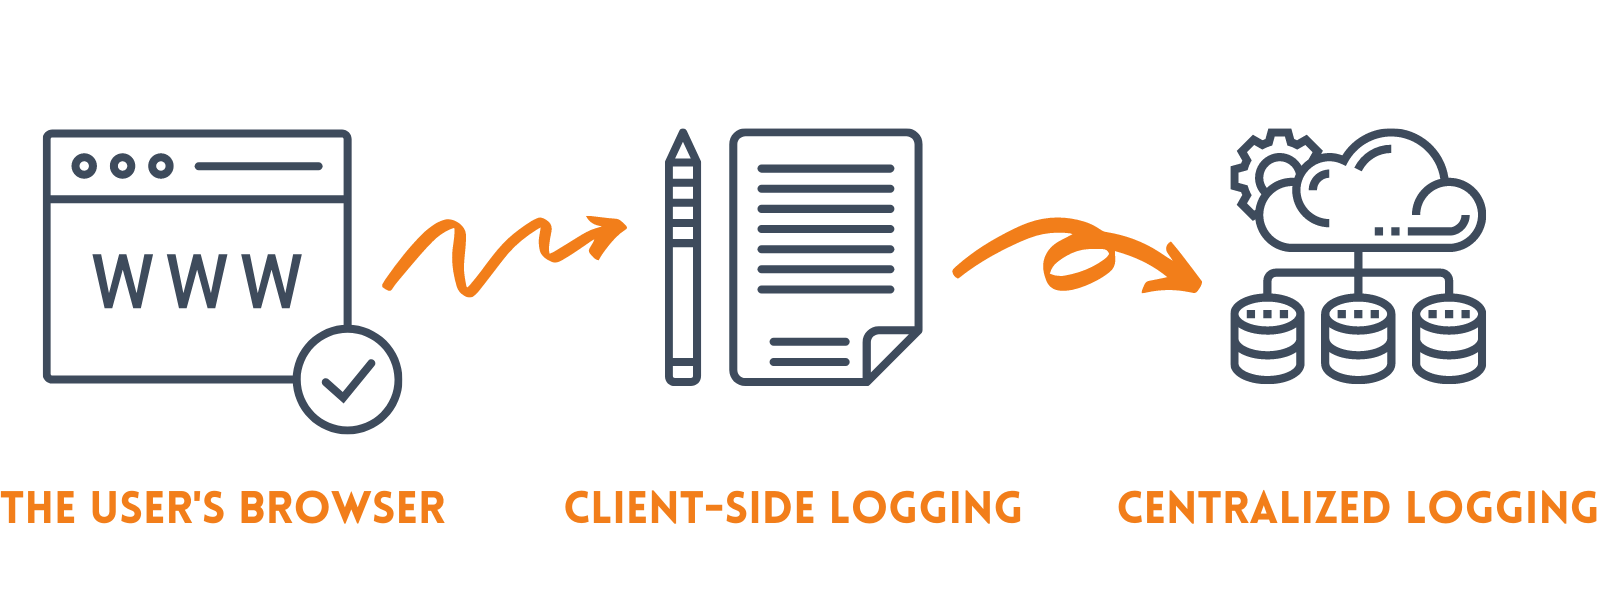
In short, client-side logging rips the logging output from the browser and sends it to a different log sink. In this case, a centralized logging system. Centralized logging allows you to view error logs from every user in one location instead of being stranded in individual user browser consoles.
Centralized logging also ensures you can access error logs after the session ends. If an error is bad enough, a user might just close the tab. That may still happen, but now you have a record of the event to reference. You can fix the error before the following user runs into the same issue and also closes the tab.
Together, they ensure you have access to the error logs no matter when or where they happen. But, if you would like more in-depth explanations of both systems, you can check our following resources:
If you wanted to only consider using one of the techniques from this article, client-side centralized logging is the one to adopt. It will make the biggest change to your troubleshooting process and is needed for the techniques discussed below.
Log the User’s Site Location and Other Information When Possible
Want to have reliable context for errors as they pop up? Log each time the user navigates to a different view. Here’s an example of a navigation log for an application in Loupe Server:
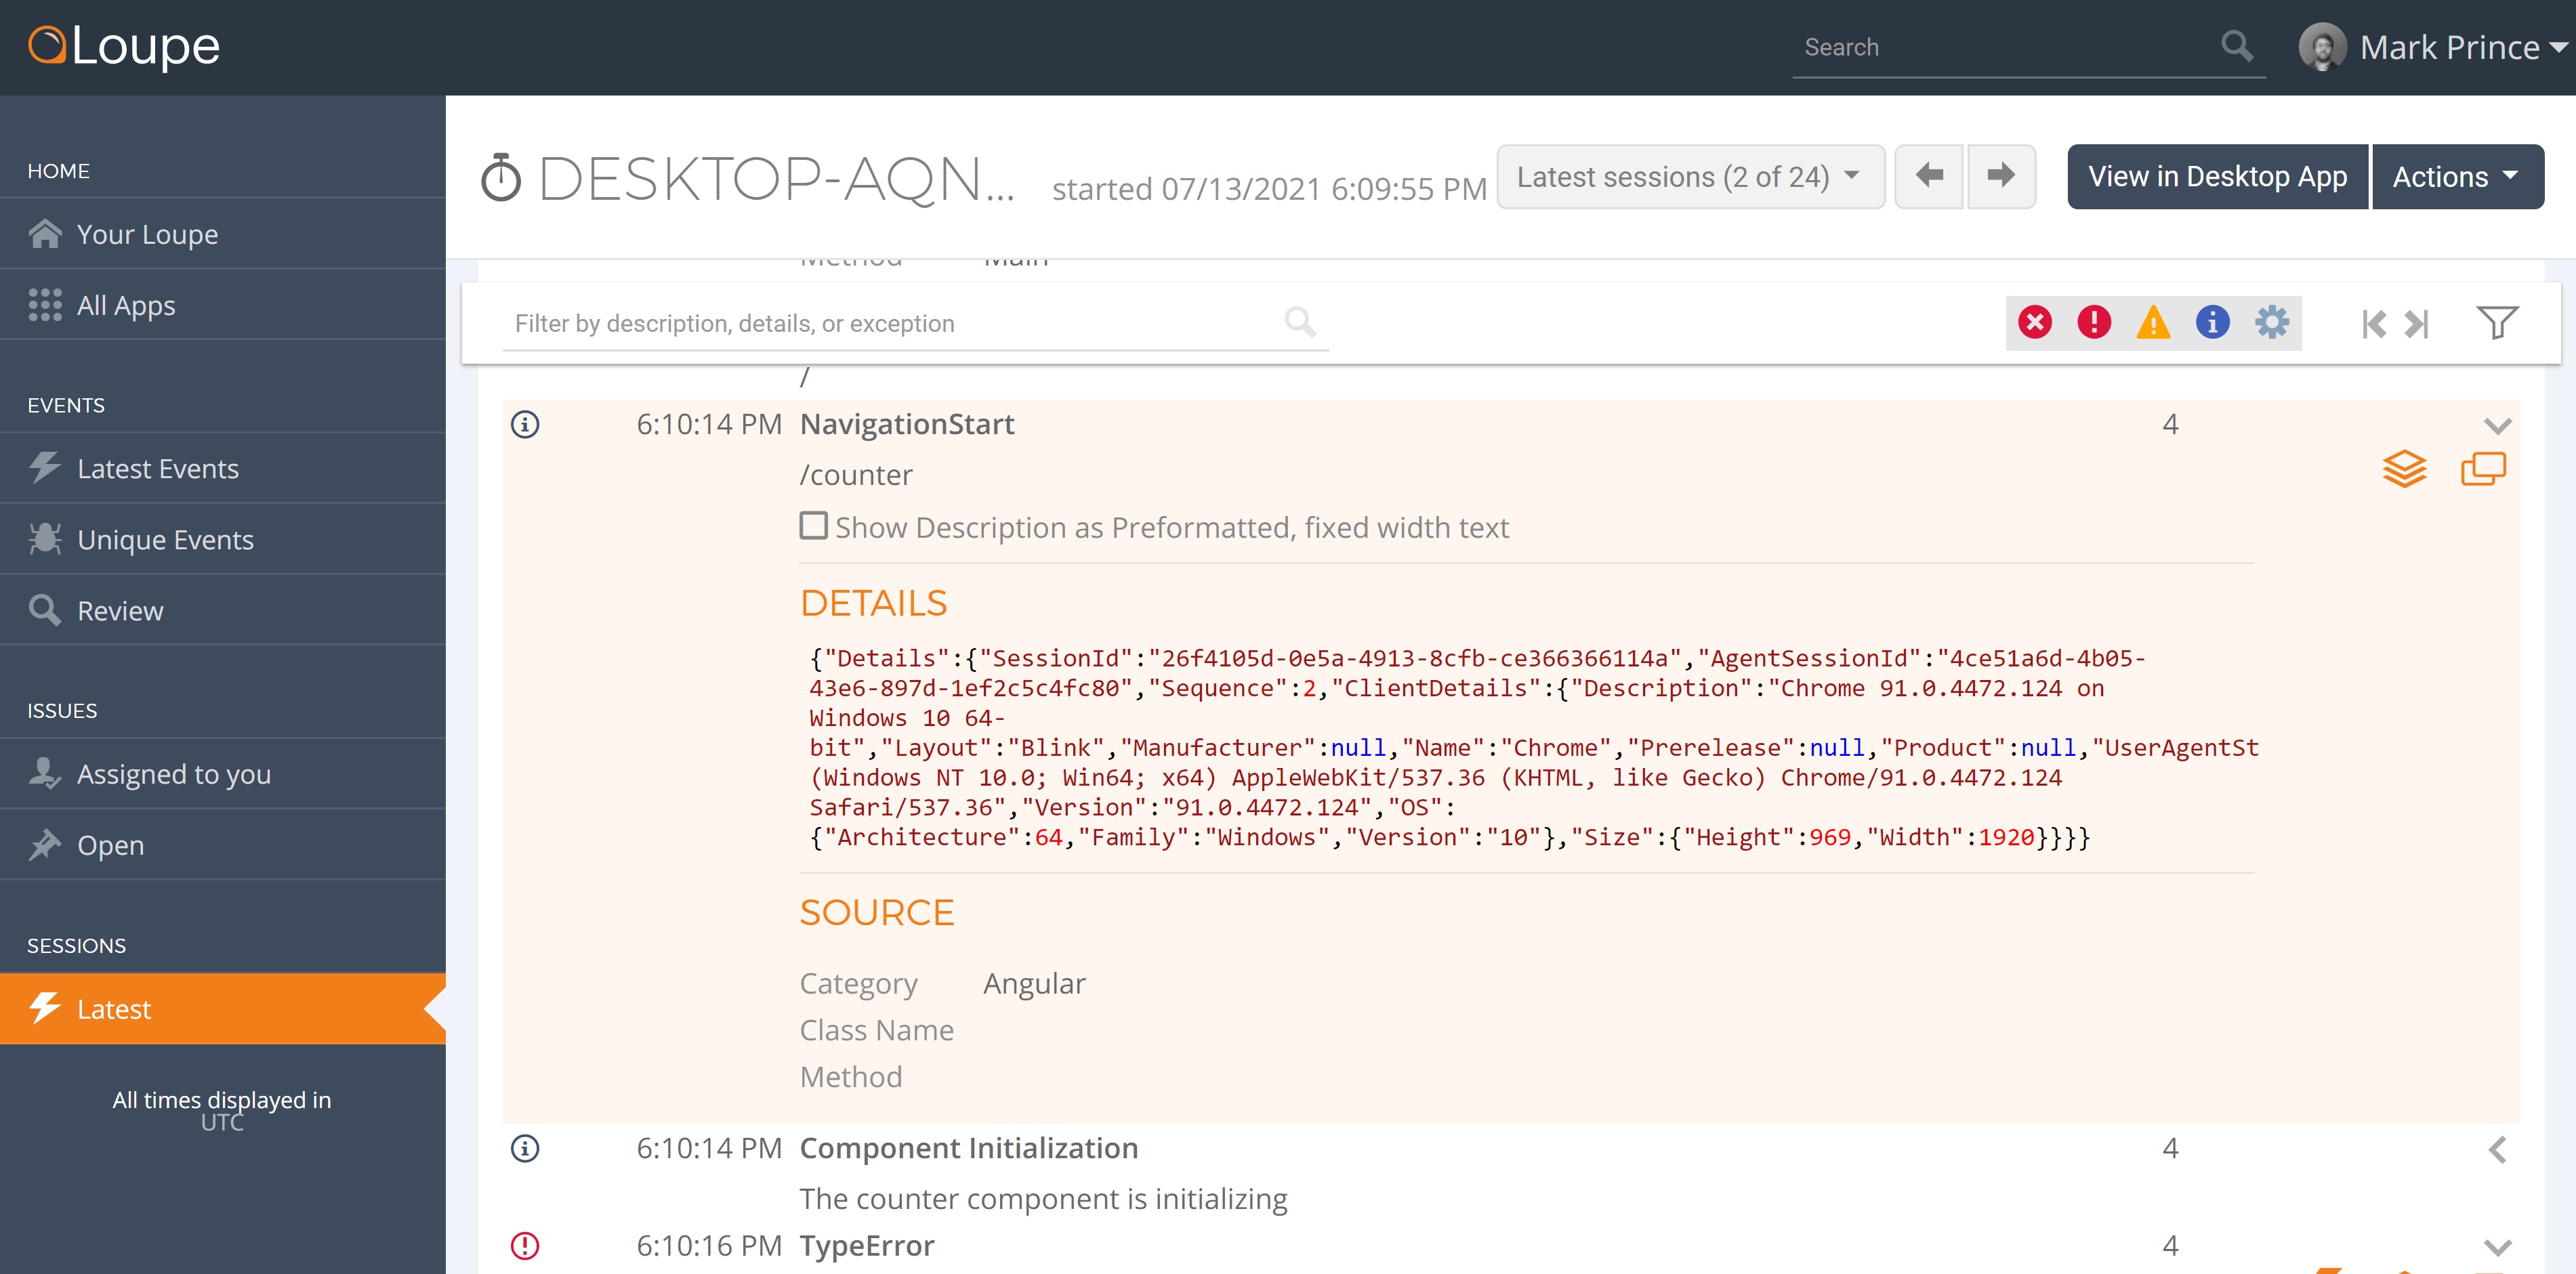
It’s a straightforward log message, tells you a navigation event occurred and the relative URL for the destination. Included with the log message is a group of details covering the browser version and machine specs. In this case, the browser used is Chrome, and the machine is a Windows 10 desktop. These details make it easier to recreate a problem, as you have already narrowed down the browser and platform. Once the error is recreated to those specs, you can test and see if the problem occurs elsewhere, and get closer to a solution.
I’ve written about logging Angular navigation events previously, but not about including more details inside those logs. That’s because I’m generally using the Loupe agent, which includes this information automatically with every log, so I don’t have to think about it. I like it because it allows me to keep the code a bit cleaner. Logging has a bit of a reputation of increasing code complexity, and it does. But the trade-off is almost always worth it because it makes solving problems so much easier.
If you’re not using a logger like Loupe that automatically includes this kind of data, prioritize manually logging information on the user’s browser (which browser, what release) and the user’s machine (OS and viewport size). That should be enough to point you in the right direction or help you recreate the error if necessary.
Use a Form of Log Monitoring
If you want to know when errors happen in your application, look into adding a real-time log monitoring solution. Log Monitoring allows you to create an alert whenever an error happens in production. Generally, this will be an email sent to the developers, or a message sent to a messaging app like Slack.
Whatever the format of your alerts, a few problems need to be solved for log monitoring. For one, you don’t necessarily want it to trigger for every single error. Sometimes an error will repeat itself hundreds, thousands of times over a short period. Getting that many emails in a minute will ruin any chance you have of inbox zero and potentially hide other errors. Be sure the log monitoring you use can handle similar errors over a short period intelligently (Loupe Server will send one initial email, then emails periodically letting you know if the situation is ongoing).
Also, you will want to control which versions of the application send alerts. You want alerts from the production application. But do you want them from every beta branch? Likely not. Set your alerts only for the most critical applications, that way you know to pay attention to the alert when you get one.
Putting it All Together
Effective Angular error logging requires a lot of thought put in ahead of time. But it’s worth it for your application’s sake. Knowing the exact error that occurred, the context in which it occurred, and as it occurs will allow you to respond to errors quickly and thoroughly.
Sounds like a lot of things to add to your application? Luckily, you can effectively log Angular errors by just integrating your application with Loupe Server. Loupe Server is a centralized logging platform with real-time log monitoring and a client-side logging agent designed explicitly for Angular applications. You can learn more about Loupe Server here, or try our free trial in the link below.