Live Logging With Serilog for ASP.NET Core
| Last Update | November 11, 2021 |
The most common log sink for Serilog users is a file according to the NuGet package manager. It shows the Serilog.Sinks.File package as the most downloaded compared to the others:
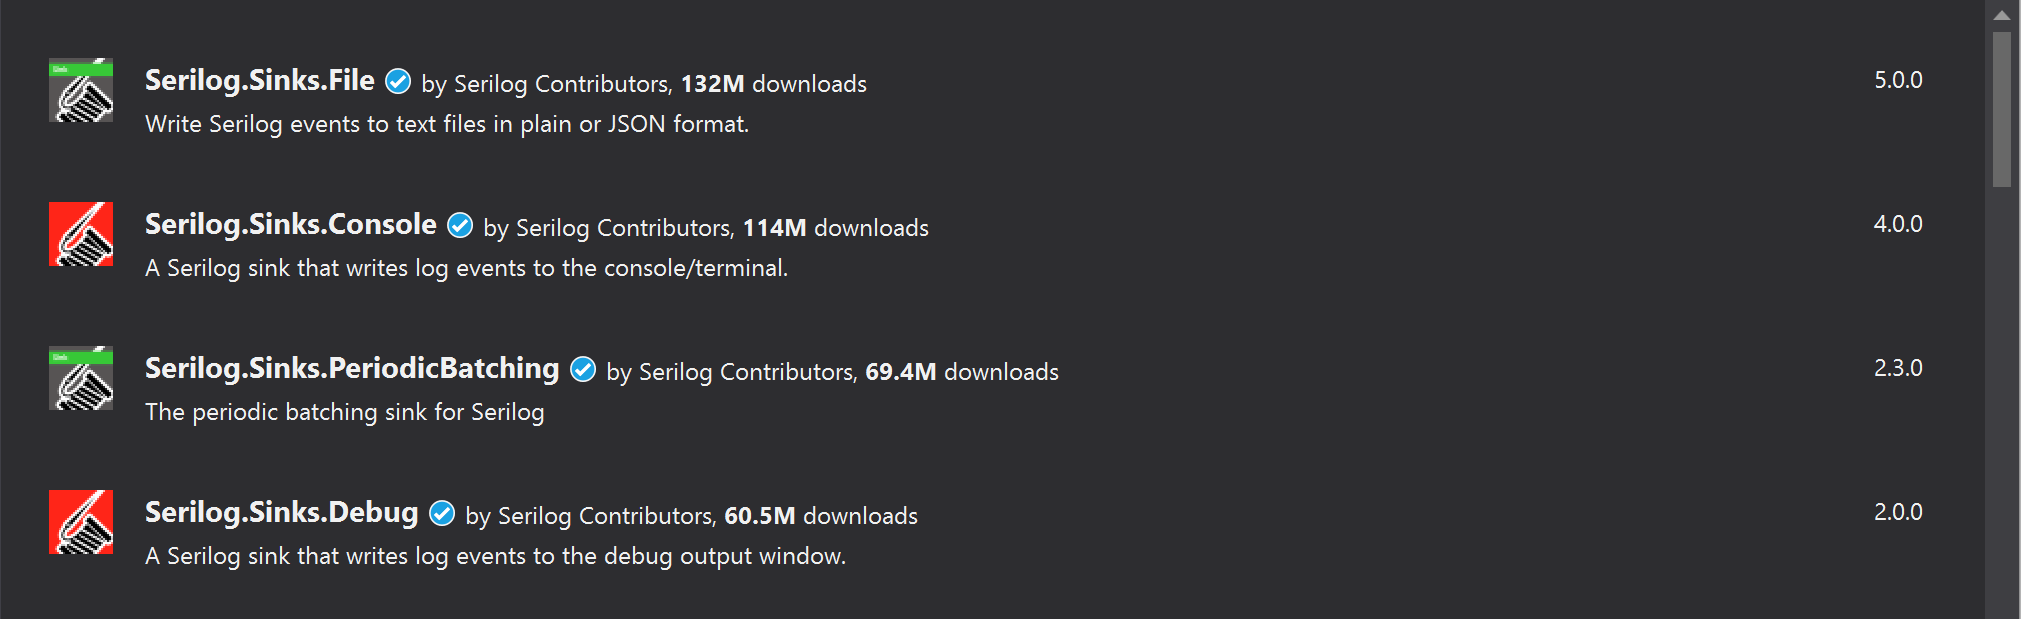
The popularity of logging to file makes sense. Files are permanent, and Serilog has extensive formatting options that make log files easy to read (like Serilog.Expressions, for example). But to create the log file, the session needs to end. As long as the application is open, you don’t have access to the most current logs.
That’s why live log viewers are a vital tool for application developers. A log sink like the debug, the console, or a dedicated log viewer lets you access the logs without closing the application. So if you want to see log output in real-time, you can! It’s convenient when troubleshooting a tricky error as viewing the application and logging together can provide essential context. Even better, the templating and log enrichment options that make Serilog great are available for many of the live log viewers as well.
In the best-case scenario, you have a form of both live log viewing and permanent logging. Here, we will primarily focus on live log viewing and run through several sink options that work with Serilog.
The Example Application
For this article, the example application is the ASP.NET Core template application running on .NET 5. But, the techniques/tools used here work across the rest of .NET Core, including .NET 6. If I were to set this up from scratch for .NET 6, I would possibly adopt the new minimal .NET 6 hosting model. But that method is not supported across the entirety of .NET Core. So for this article, I’ll keep the generic hosting model for .NET 5.
What that means is I’m just adding Serilog through the Main() method like so:
//Note, this example is writing to the Loupe Sink

public static void Main(string[] args)
{
    Log.Logger = new LoggerConfiguration()
        .WriteTo.Loupe() //Call to Serilog Sink
        .CreateLogger();
    CreateHostBuilder(args).Build().Run();
}
Additionally, I have added two logs to the stock ASP.NET Core template application.
- A warning log on the home page:
Log.Warning("This is the Home Page!"); - An error log on the privacy page:
Log.Error("This is the Privacy Page!");
These logs are easy to differentiate and activate right as I enter the web page, making them helpful in testing live logging. So let’s use this setup to compare the debug, the console, and Loupe Desktop.
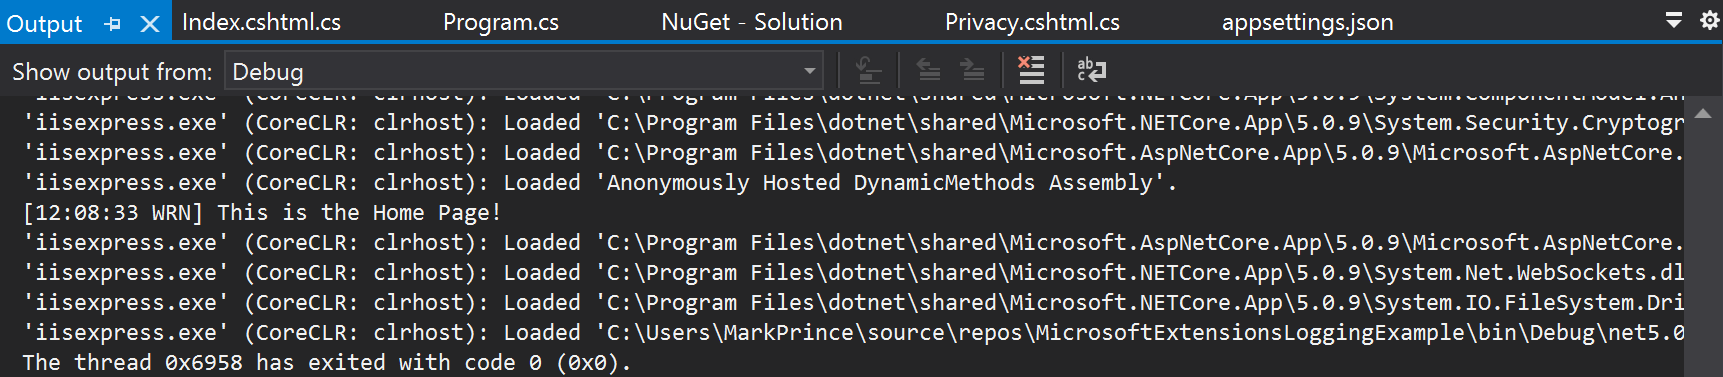
Using the Debug
The Debug is the default log sink for Microsoft.Extensions.Logging, often the first sink you will use for a .NET solution. For Serilog, logging to the debug is not as common, but still possible.
The gif above shows live logging with the debug, me switching between the privacy and home pages. In this ideal scenario, with only two logs and a bare-bones application, it looks pretty good! There is a slight delay between navigating to the page and the log showing up, but it’s not nearly enough to be a significant bother.
Once you add even a few more logs though, the debug becomes pretty hard to scan, even for our template application:
Other than the length of the message, there is not much to differentiate each log at a glance (and in an actual application, the log message will likely be longer). This can become a problem for complex applications with more verbose logging. Logs pass by so quickly, visual cues may be the difference between seeing an error or not. But this can be counteracted by simply searching for what you want to find. You can ctrl-f your way through the debug output. Not a perfect method, but effective if you know exactly what you’re looking for.
As a built-in default log sink right in Visual Studio, debug is not bad. It works in real-time, you can search through it, and it requires minimal setup or knowledge to start using. But for a long-term solution, a sink with more visual detail is worth considering. Let’s see how the console compares.
Using the Console
The console is the second most popular sink for Serilog, just behind logging to file. By default, Serilog uses a console theme (SystemConsoleTheme.Literate) which adds coloring to make it easier to parse at a glance.
The console above is already easier to read than the debug with no additional formatting. Plus, it doesn’t have the perceptible lag shown for the debug. But these logs don’t contain any additional diagnostic data for us besides the message. So, let’s add some using enrichers!
public static void Main(string[] args)
{
  Log.Logger = new LoggerConfiguration()
    .MinimumLevel.Override("Microsoft", LogEventLevel.Information)
        .Enrich.FromLogContext()
        .Enrich.WithProcessId() //Enricher
        .Enrich.WithProcessName()
        .Enrich.WithThreadId()
        .WriteTo.Console(outputTemplate: "[{Timestamp:HH:mm:ss} {Level:u3}] {Message:lj} {NewLine} {Exception} {Properties} {NewLine} {NewLine}")
    .CreateLogger();
  CreateHostBuilder(args).Build().Run();
}
Here I’ve added some enrichers from the Serilog.Enrichers.Process package and Serilog.Enrichers.Thread package.
Additionally, I’ve modified the output template to add line separation and {Properties}, a catch-all for the enriched content displayed as JSON.
This is the resulting output in the console:
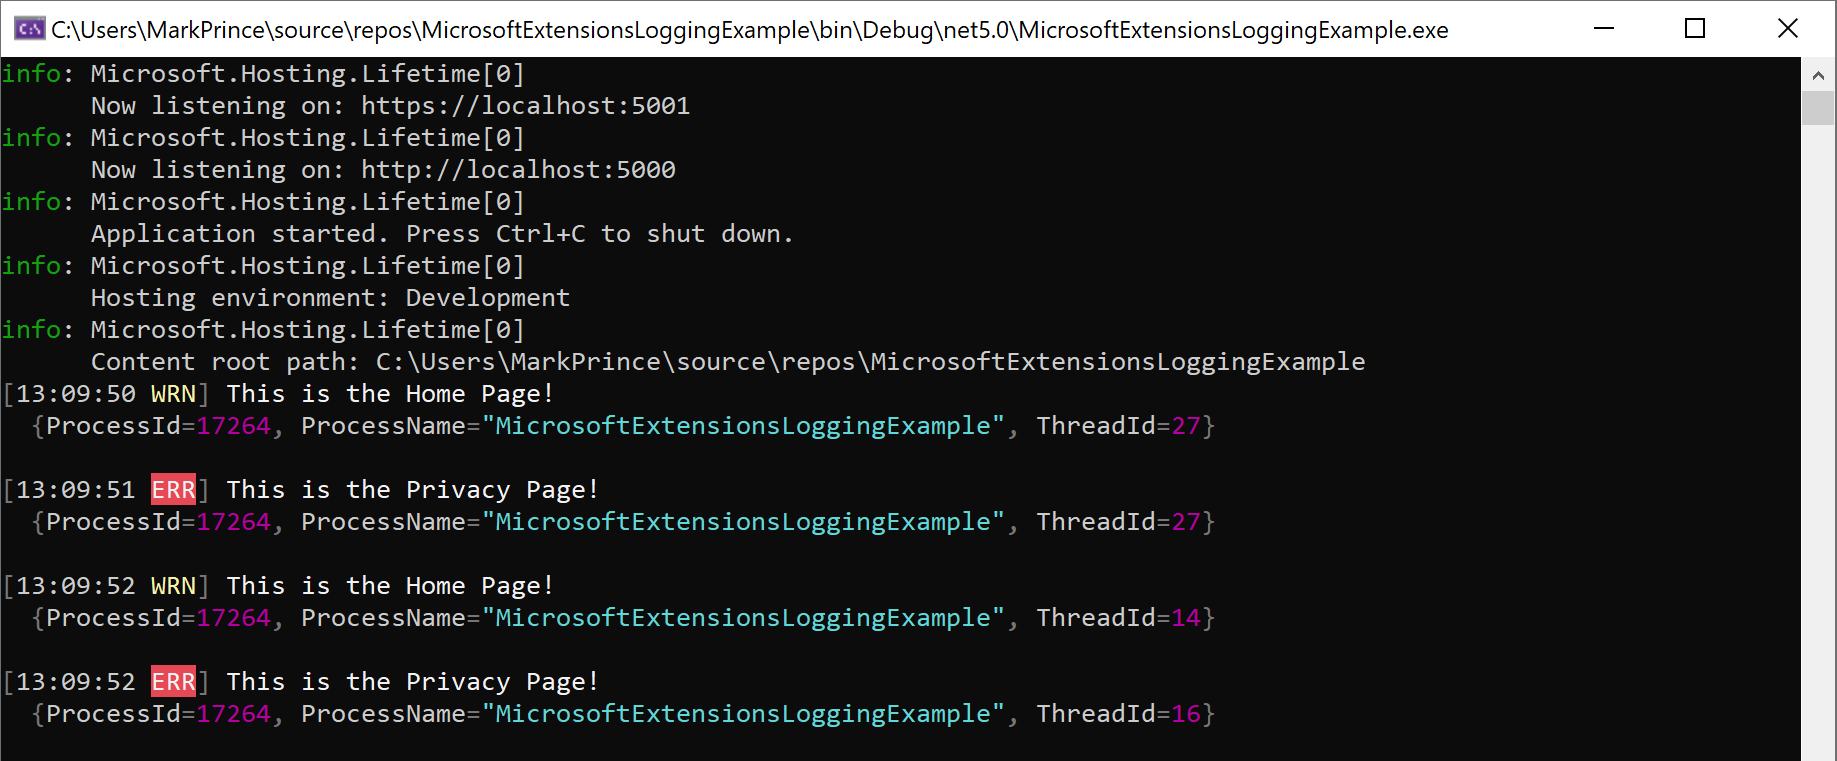
Note the additional details and coloring, making the console easy to read. You can also use the enrichers and templating with other sinks, like log files and even the debug (debug still suffers a bit in readability even when templated).
But there are still limitations with the console. The best way to navigate through your logs and filter the data is ctrl-f, and it’s still not a permanent record. Once I exit the console, the logs are gone. I can use an additional sink to alleviate the problem, but it’s not a perfect solution. Writing to the console is relatively expensive from a performance perspective, and logging to a file simultaneously won’t help. It’s worth looking for dedicated log viewers that can support live log viewing and save the data long-term.
Using Loupe Desktop
The example dedicated log viewer I used is Loupe Desktop. Loupe works locally and remotely with a private Loupe Server. This makes Loupe a possible option for applications in production, where the user may be on the other side of the globe. For the sake of this article though, I ran the app locally to make it easier to record both the browser and Loupe. Let’s look at the application alongside a peek of the Loupe viewer:
The gif above shows Loupe has no perceptible lag, the log severity is clearly marked, and each log includes a set of diagnostic details. It’s worth noting I removed the enrichers and output template for this example. Loupe doesn’t require any templating as it automatically organizes additional diagnostic data into dedicated columns. It collects the data I previously added with the enrichers by default, plus data such as class/method name and even the source code.
Additionally, Loupe Desktop has several ways to simplify navigating live data, such as the log severity filtering options.
Finally, when the session is over, the entire record is saved for you to view at a later time. This way, you have access to live log viewing along with the benefits provided by a log file. Best of both worlds.
Which Option Should I Use?
If you don’t want to use a 3rd party log viewer, or can’t install additional tools in your dev environment, the console is a good choice. Serilog has done an excellent job adding templating and enrichment options that make it a fantastic logging framework for any sink you want to use.
But we feel like Loupe Desktop is a good fit for anyone looking for live logging on .NET, whether using Serilog, Microsoft.Extensions.Logging, both, or another framework. It allows you to put less of your log formatting in the application itself, and lets your log sink do the heavy lifting. You can learn more about Loupe Desktop in the link below.