Using Loupe to Make Our Free Trial Better
We just updated Loupe to include new context-sensitive informative content for trial users! Now whenever a brand new trial user navigates to a page, Loupe will let you know what the page does, whether it has received any data, and where in the error triage process the page fits. This way, it is easier for any user to understand Loupe, no matter what their role is in the development process.
Why make changes to the trial?
Log monitoring software is pretty daunting to use at first. It’s not like other applications that you can install and get started with immediately. With a calorie counting app, you install it, look up what you’re eating, and get the calorie count for the food. Immediately useful, with only minimal effort required.
In contrast, log monitoring software asks you to do some work before you can see the benefits:
- Integrate the software with your application
- Configure your logging framework and software to only show the logs you want to see
- Troubleshoot any problems that come with adding a new feature
Let’s take a look at the first screen users would see in the previous trial for Loupe:
This is our greeting, a work item for the developers. We can’t really avoid it. Loupe can’t collect your applications logs if it’s not integrated into the application. And at its core, Log Monitoring software is designed to help developers. Starting the user experience with a set of coding instructions makes sense.
In reality though, Loupe is used and tried out by all kinds of folks in the software development space, not strictly just devs. Project managers, operations, and support staff can also benefit from Loupe and often sign up for the trial as well. Previously, our trial experience was offering a poor experience for them. How did we know? Well, the proof is in the logs.
What’s in the Logs?
It’s not a secret that we use Loupe to help diagnose and monitor problems with, well, itself. Just like many developers who use the product, we also have our eyes on real-time log feeds and have application alerts set up for ourselves. But not every problem is represented with an obvious error.
We’ve noticed over the last year that our trial conversion rate has been dropping. This is a concern for any product team, so I started digging into our telemetry for trials started in the last 90 days, specifically instances where a user never integrates an application (AKA appears not to use the product). Before viewing the data, I had two theories as to why users would never upload data:
-
There was some error/event occurring for some of the trials, and instead of contacting support, people would get a bad impression and leave.
-
Users would complete the trial signup (which isn’t effortless, signing up for any service is a bit of work), see the instructions for integrating their application, and exit because they thought the juice wouldn’t be worth the squeeze.
Theory one was disproved by the log data. There were no fatal error logs during the trial signup process for any of our users on either the Gibraltar Service website or the Loupe Server software itself. And I could see that users had sessions for both the service site and Loupe in chronological order.
Theory number two wasn’t entirely accurate either. The first hint was the length of the initial user sessions: If people were immediately exiting, the sessions would be pretty short. Often though, the first sessions were five to ten minutes long. Not super long, but not an immediate exit either. So, what was going on?
Analyzing individual user session logs with Loupe
I’m thankful that Loupe tracks the metadata it does. Loupe associates Log messages with both individual users and individual sessions. I can easily identify a user’s first session with the application and analyze that data separately from the rest of the session logs (a session by default contains all the log data generated by a process, not per user, so on a busy web cluster there’s a lot in there!).
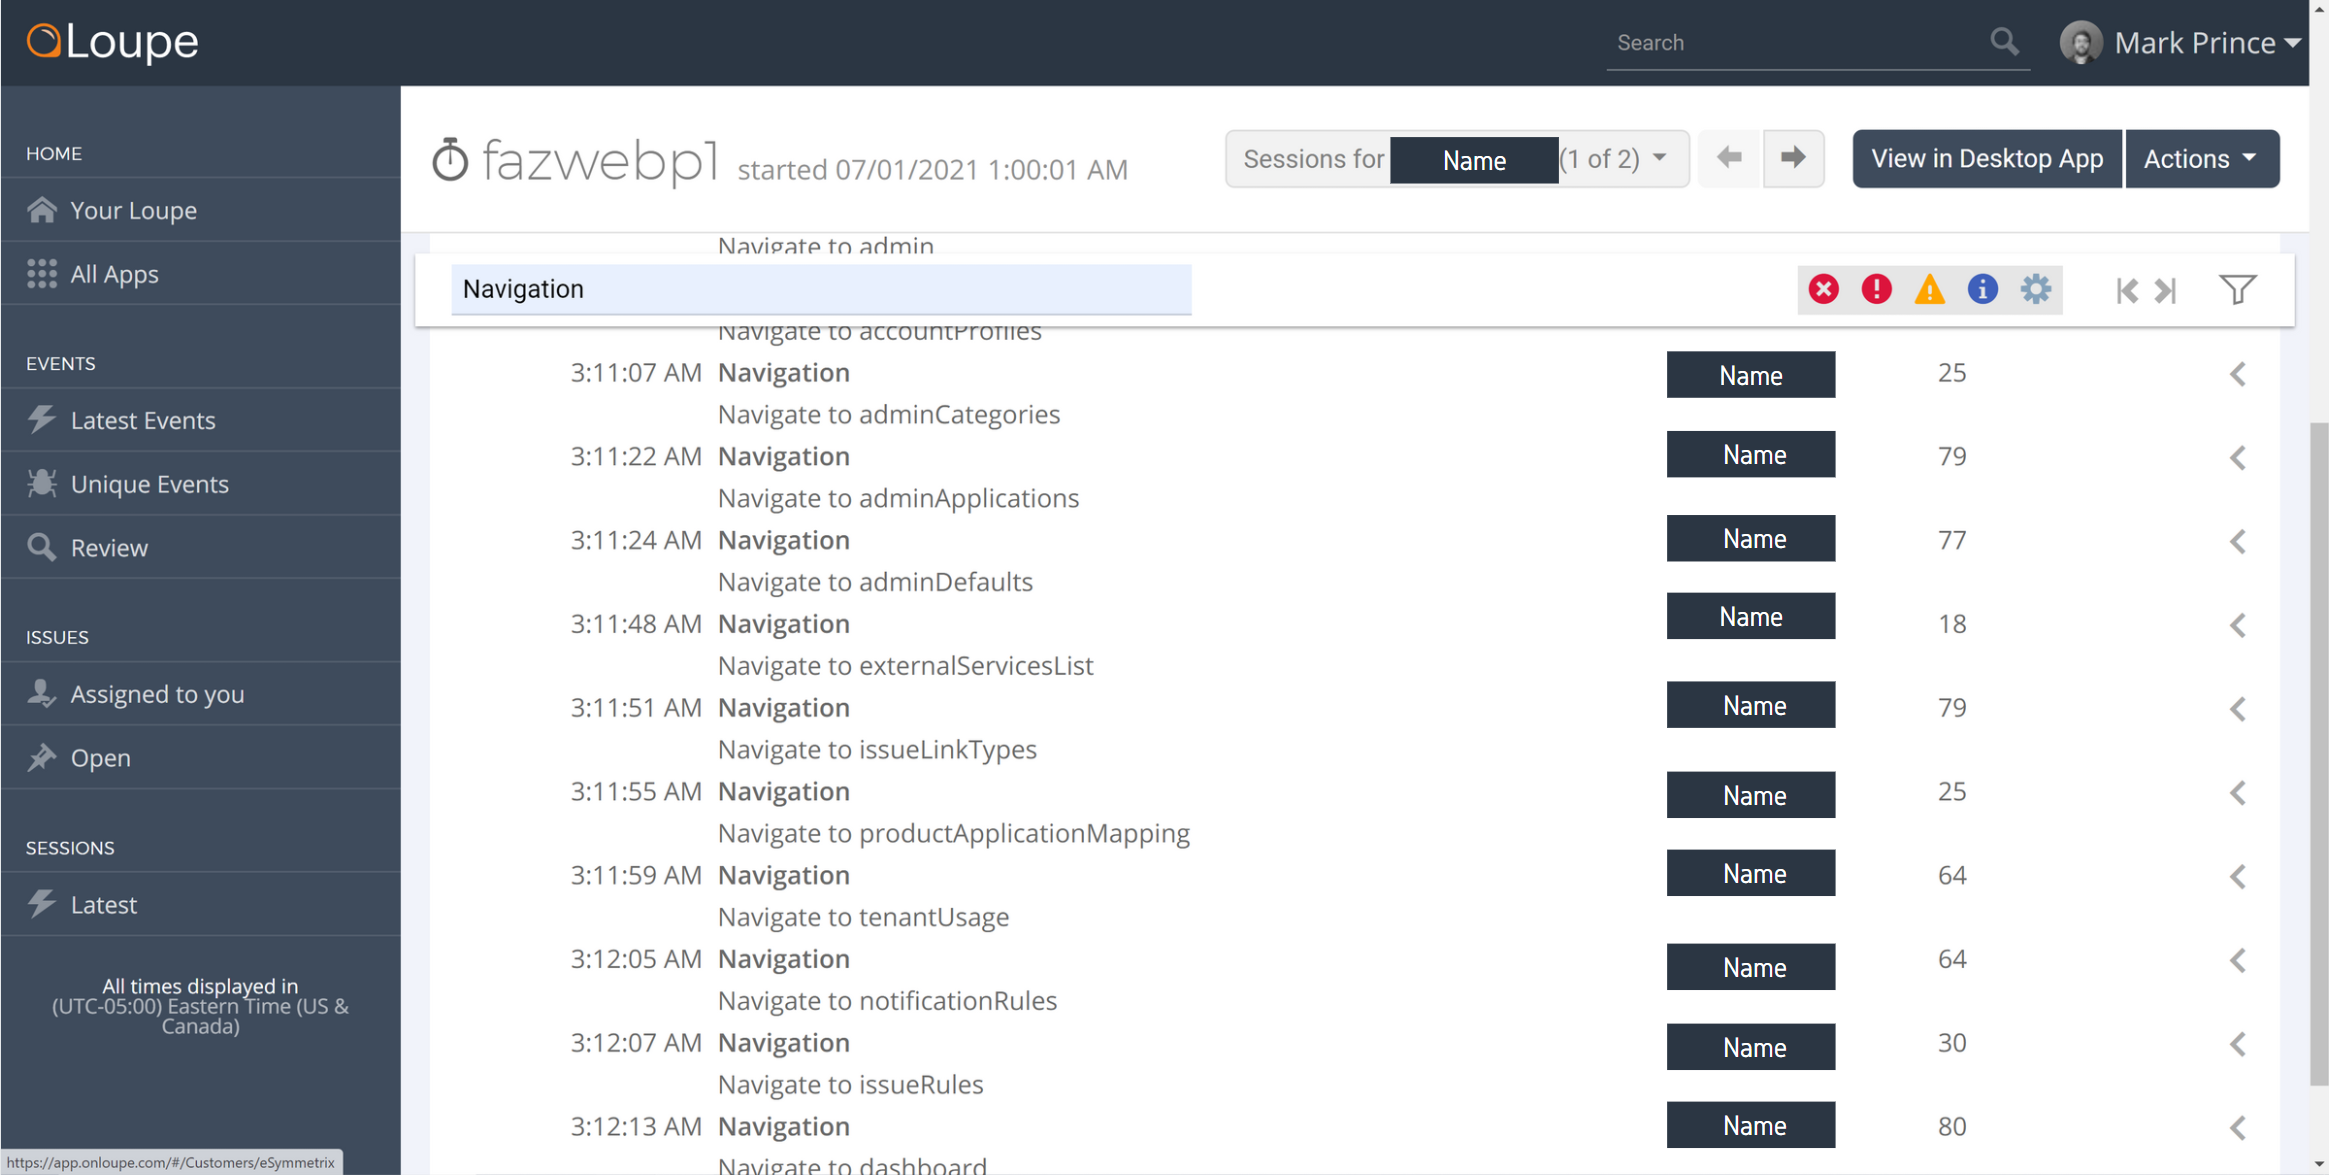
From there, I used a search to narrowed the scope of the data to just the Navigation event logs for the session (logs you can create using our client-side logging agent):

The data showed that users spent a lot of time navigating to each page in the dashboard, the admin menus, and sometimes throughout the whole application. Which, at first, I found odd. Why would you look at the Issue pages when you haven’t made any issues? Or the Event pages if you haven’t logged any events?
With some thought though, it makes sense folks would click the pages:
-
The terms “Events,” “Issues,” “Sessions,” etc., are not universal, and users want to use context clues to figure out a term’s meaning. If you wanted clarification on what “Event” means in Loupe, clicking on one of the event pages is a very reasonable action to take.
-
The first thing users see is the code that adds Loupe to their application. But not every user can access the code and will have to ask someone else to do it. Clicking on other pages to see if there is a way to assist, or see if the task will be worth it, is reasonable.
-
Sometimes, you just want to click through the software and see if it appeals to you visually, performance-wise, etc.
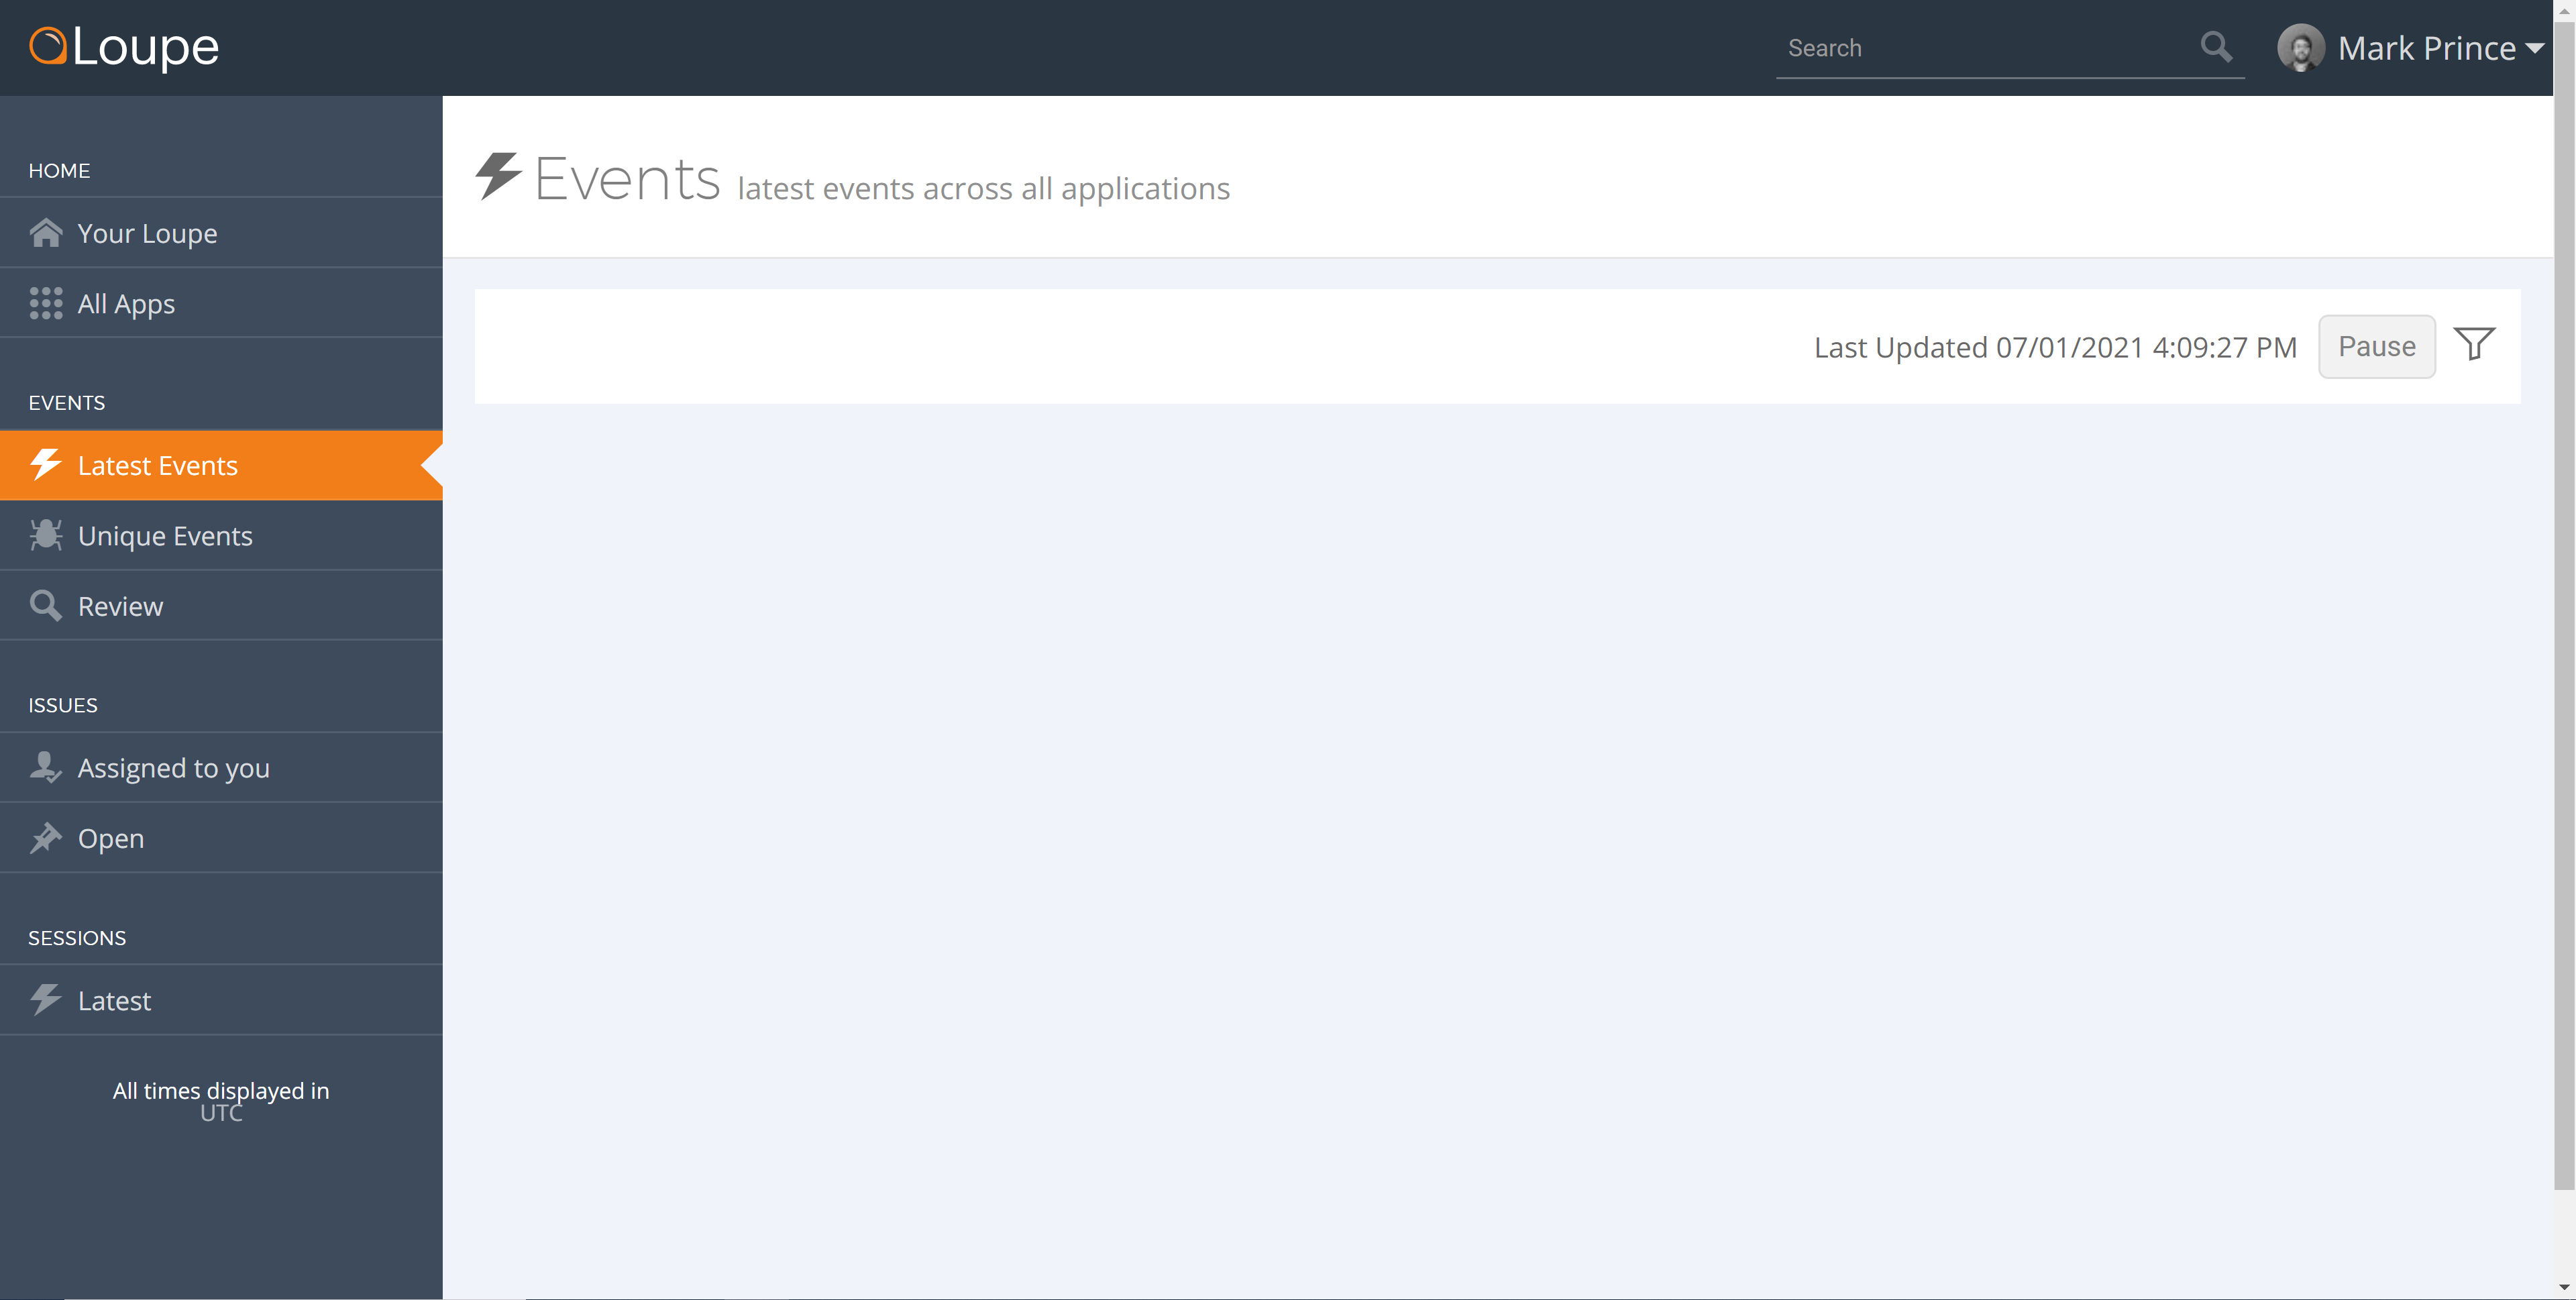
Seeing this behavior was a bit of a relief at first. It meant that the trial users were not immediately abandoning the software! But when I started up a new trial and navigated the pages myself, there was an apparent problem:

The dashboard pages are mainly empty. Loupe isn’t displaying any data because, well, there’s no data. Even if it makes programmatic sense, it isn’t a good user experience to just see blank pages. The page isn’t explained in any way, looks like it’s maybe broken, and just doesn’t offer a reward for taking the effort to use the software in the first place.
So, looking through the log data didn’t reveal any dramatic or catastrophic error. It instead revealed a problem with the user experience. Just another example of how log data can contain more answers than you think.
How Did You Solve the Problem?

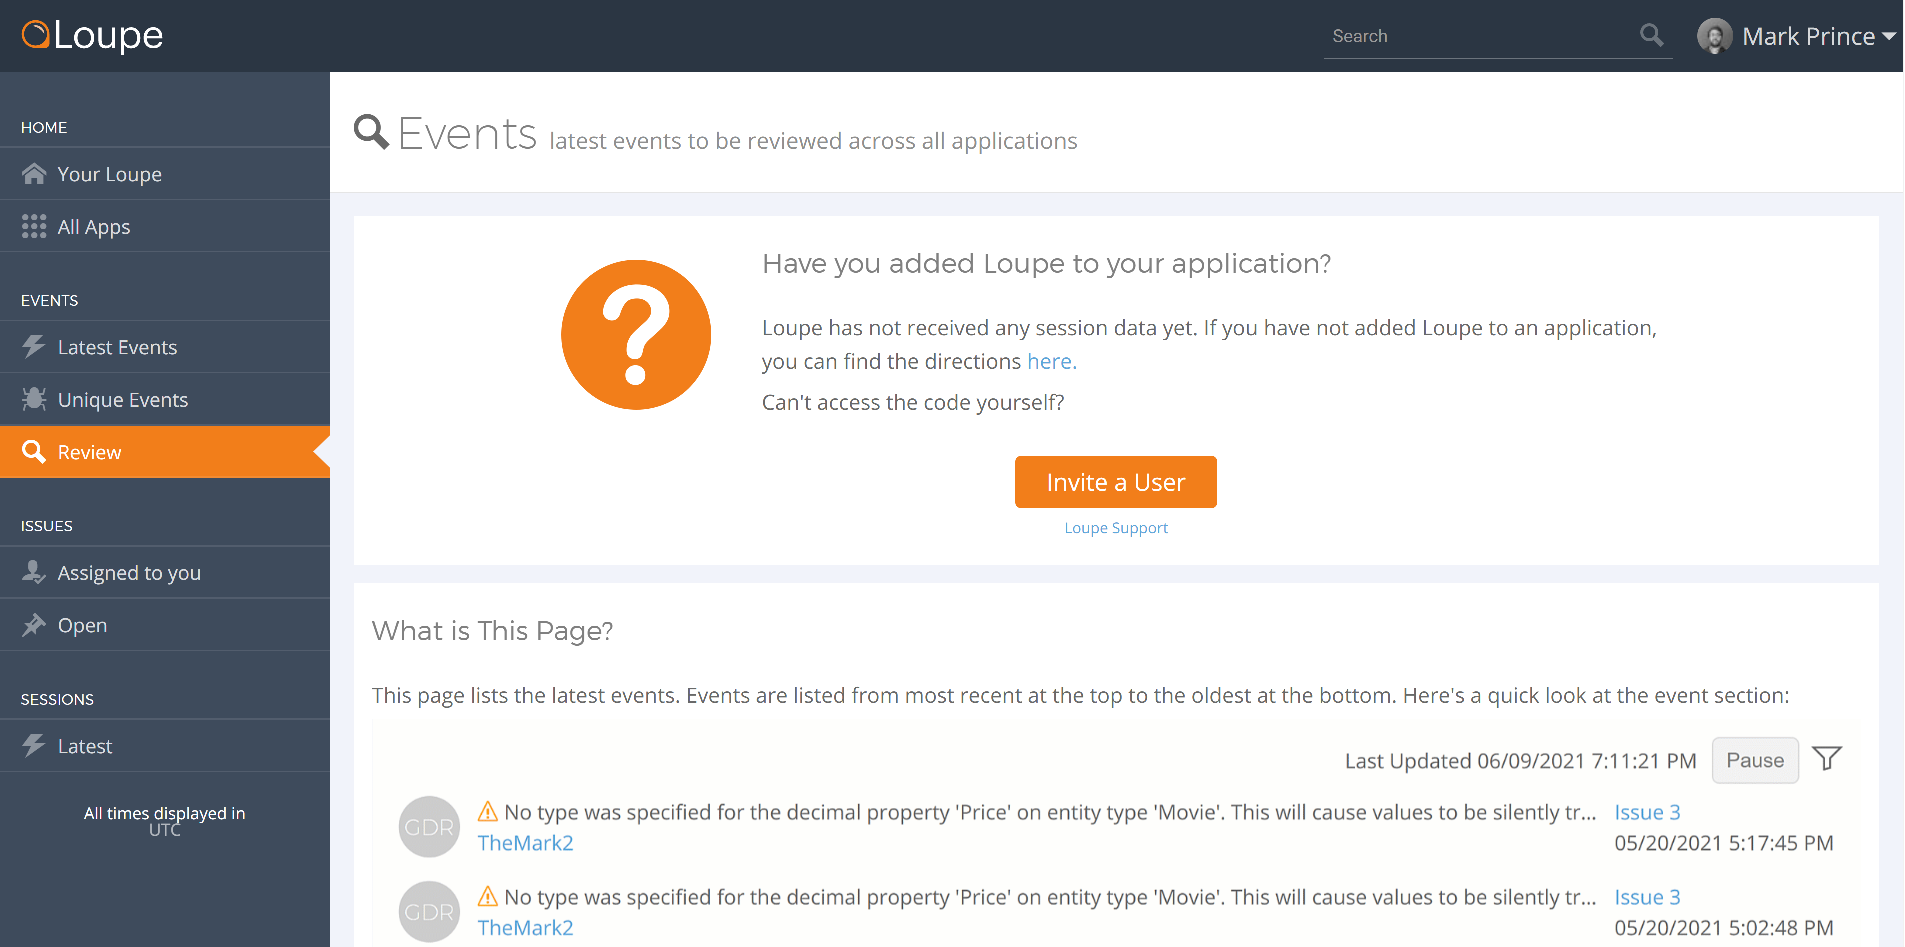
As a start, we have added content to all these pages to help users learn three things:
-
Learn why the page doesn’t have any data. It’s not always because the application hasn’t been integrated. Sometimes the events page will be empty simply because your application hasn’t logged any errors or warnings. Now, the page will notify you whether session data is coming through and what needs to happen next for the page to start working.
-
Learn what happens on the page. What’s the difference between the Event pages, the Issue pages, etc. Essentially, justify why there are multiple pages for each item as it may seem excessive for new users. Also, we now have a gif (technically mp4) per page showing how it will look.
-
Learn the broader page item. As I stated before, “Issue,” “Event,” and “Session” are not universal terms. It’s worth taking the time and space to explain these terms clearly.
The order of these items is prioritized for the devs. They’re the ones who ultimately need to get Loupe working, so answering their questions is still the priority. That’s also why the first page for the trial is still a set of directions. For many of our users, that’s the most important item for them to see.
But I am thrilled that we now include the information needed for other users to understand Loupe too. Because in many organizations, the support staff, operations, project managers, marketing, and others will use the program. And we’ve accounted for this, Loupe Server has features designed to make their jobs more manageable as well. What we failed to do is account for the fact that these users may also be the first people in their organizations to use Loupe. I am happy to include any information that will help them understand it better.
So, if you haven’t tried Loupe yourself (…or tried in the past and were confused by the empty pages), now is a great time to jump in. You can learn more about Loupe Server on this page, or sign up for the trial in the link below.