Tracking Java Application Metrics with Loupe
Loupe has always been about more than logging - from day one it’s had the ability to gather other forms of telemetry as an application runs. Loupe supports time-series values (we call these “sampled metrics”) and detailed custom events (we call these “event metrics”).
For in depth instructions on creating and registering metrics, please see Creating Custom Metrics in Loupe
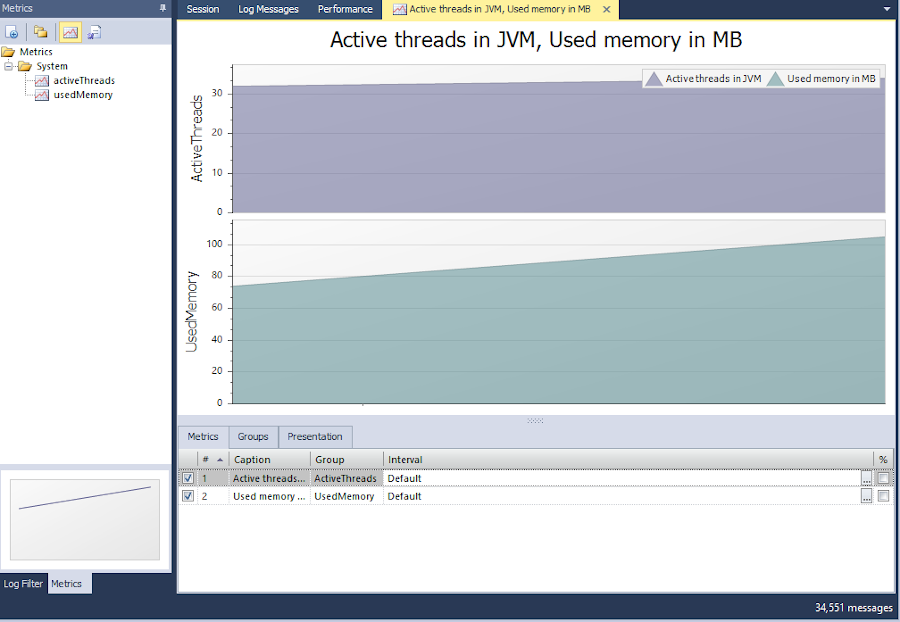
Resource monitoring out of the box
Any seasoned Java engineer knows that heap size and the number of active threads in a JVM are two key indicators of the health of their application, so we provide these out of the box:
Capture what matters
Loupe supports two distinct models for recording metrics: Event metrics and Sampled metrics.
Event Metrics
Event metrics are intended to capture details of each occurrence of an event in your application. Multiple data values can be included in each event, allowing for a wide range of analysis from the same data. The simplest way to define and record event metrics is to create a class to represent the metric and use annotations to tell Loupe the way you want it modeled as an event metric, like this:
@EventMetricClass(namespace = "yourApplicationName", categoryName = "Database",
counterName = "Query",
caption = "Database Query Performance",
description = "Performance data for every database query")
public class DatabaseMetric implements Closeable {

	private String query;
	private int rows;
	private Instant startTime;
	private Duration duration;
	private String result;

	public DatabaseMetric(String query) {
		super();
		this.query = query;
		this.result = "Success";
		startTime = Instant.now();
	}

	@EventMetricValue(name = "queryName", summaryFunction = SummaryFunction.COUNT,
	caption = "Query Name",
	description = "The name of the stored procedure or query that was executed")
	public String getQuery() {
		return query;
	}

	public void setQuery(String query) {
		this.query = query;
	}

	@EventMetricValues({@EventMetricValue(name = "duration",
	summaryFunction = SummaryFunction.AVERAGE,
	unitCaption = "ms",
	caption = "Duration",
	description = "Duration of the query execution", defaultValue = true)})
	public Duration getDuration() {
		return duration;
	}

	public void setDuration(Duration duration) {
		this.duration = duration;
	}

	@EventMetricValue(name = "result", summaryFunction = SummaryFunction.COUNT,
	caption = "Result",
	description = "The result of the query; Success or an error message.")
	public String getResult() {
		return result;
	}

	public void setResult(String result) {
		this.result = result;
	}

	@Override
	public void close() throws IOException {
		duration = Duration.between(startTime, Instant.now());
		EventMetric.write(this);
	}

}
In this case we’re tracking JDBC calls made by our application. Each time we perform a database query or update we want to record what happened and how long it took. To do this, we’ve just updated a common method we use to execute JDBC operations to wrap the execution with our metric, like this:
private ResultSet executeQuery(Connection connection, String query) throws Exception {
    try (PreparedStatement ps = connection.prepareStatement(query)) {
        // Execute the provided command wrapped in our metric
        try (DatabaseMetric ourMetric = new DatabaseMetric(query)) {
            try {
                return ps.executeQuery();
            } catch (Exception e) {
                // record the error info in our metric and then re-throw the exception.
                ourMetric.setResult(e.getMessage());
                throw e;
            }
        }
    }
}

private void executeUpdate(Connection connection, String query) throws Exception {
    try (PreparedStatement ps = connection.prepareStatement(query)) {
        // Execute the provided command wrapped in our metric
        try (DatabaseMetric ourMetric = new DatabaseMetric(query)) {
            try {
                ps.executeUpdate();
            } catch (Exception e) {
                // record the error info in our metric and then re-throw the exception.
                ourMetric.setResult(e.getMessage());
                throw e;
            }
        }
    }
}
Once recorded, you can analyze event metrics in Loupe Desktop, producing displays like this:
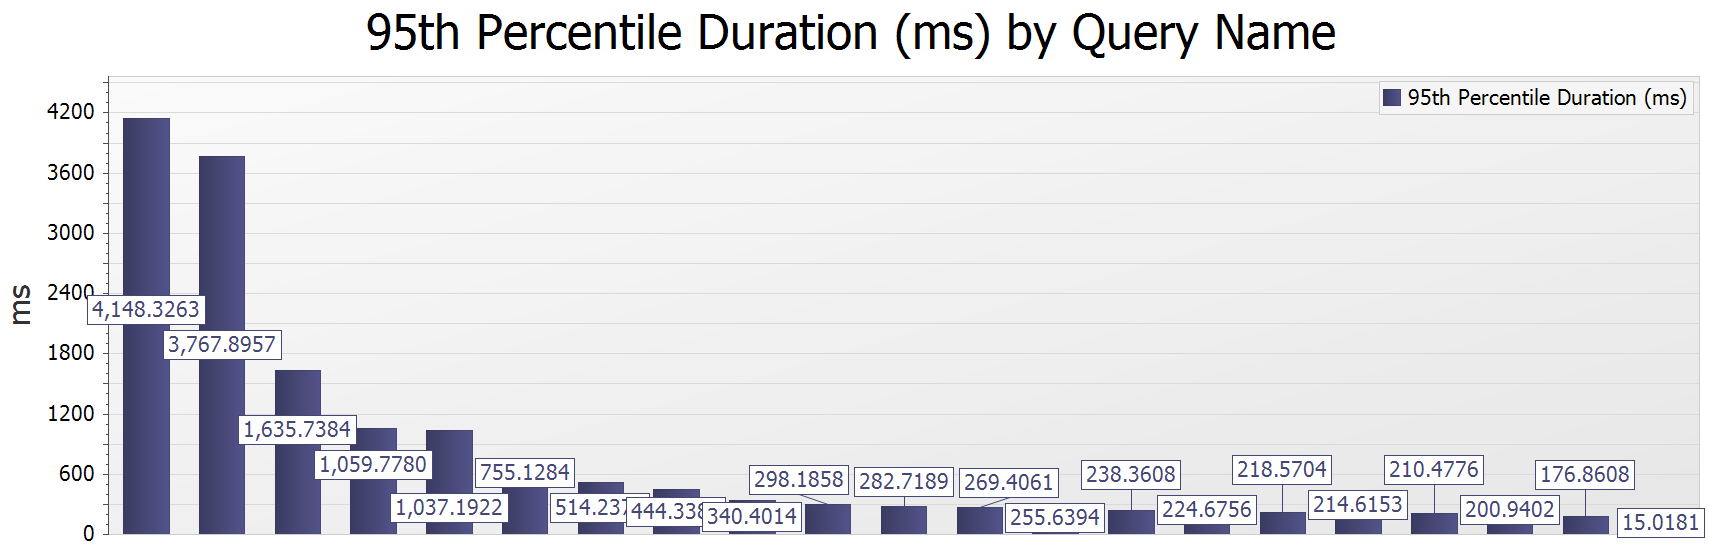
Event metrics are the most flexible way of representing the data in Loupe because we can view them as a grid of events, analyze them to find the most frequent events, slowest events, etc., and view them over time like Sampled Metrics.
Sampled Metrics
When you want to track a single value over time, use a Sampled Metric. This is great for tracking things like the number of items in a queue, the number of users on a site, processor utilization, or any other situation where you can’t afford to record every event as they happen.
Like with Event Metrics, you can easily define these by creating a class and use annotations for the definition. In this case we’re going to record the pages and size of a cache. Basically we’ll have two different sampled metrics on the same object - one for each value we want to record.
@SampledMetricClass(namespace = "GibraltarSample", categoryName = "Cache")
public class CacheSampledMetric
{
	public CacheSampledMetric(int pagesLoaded)
	{
		setPages(pagesLoaded);
		setSize(pagesLoaded * 8192);
	}

	private int _Pages;

	@SampledMetricInstanceName
	public String getInstanceName() {
		return "CacheMetrics";
	}

	@SampledMetricValue(counterName = "pages", samplingType = SamplingType.RAW_COUNT,
	caption = "Pages in Cache",
	description = "Total number of pages in cache")
	public final int getPages()
	{
		return _Pages;
	}
	private void setPages(int value)
	{
		_Pages = value;
	}

	private int _Size;

	@SampledMetricValue(counterName = "size", samplingType = SamplingType.RAW_COUNT,
	unitCaption = "Bytes",
	caption = "Cache Size",
	description = "Total number of bytes used by pages in cache")
	public final int getSize()
	{
		return _Size;
	}
	private void setSize(int value)
	{
		_Size = value;
	}
}
Each time you want to record a snapshot of the metric values, just pass the object to Loupe, like this:
SampledMetric.write(new CacheSampledMetric(pagesLoaded));
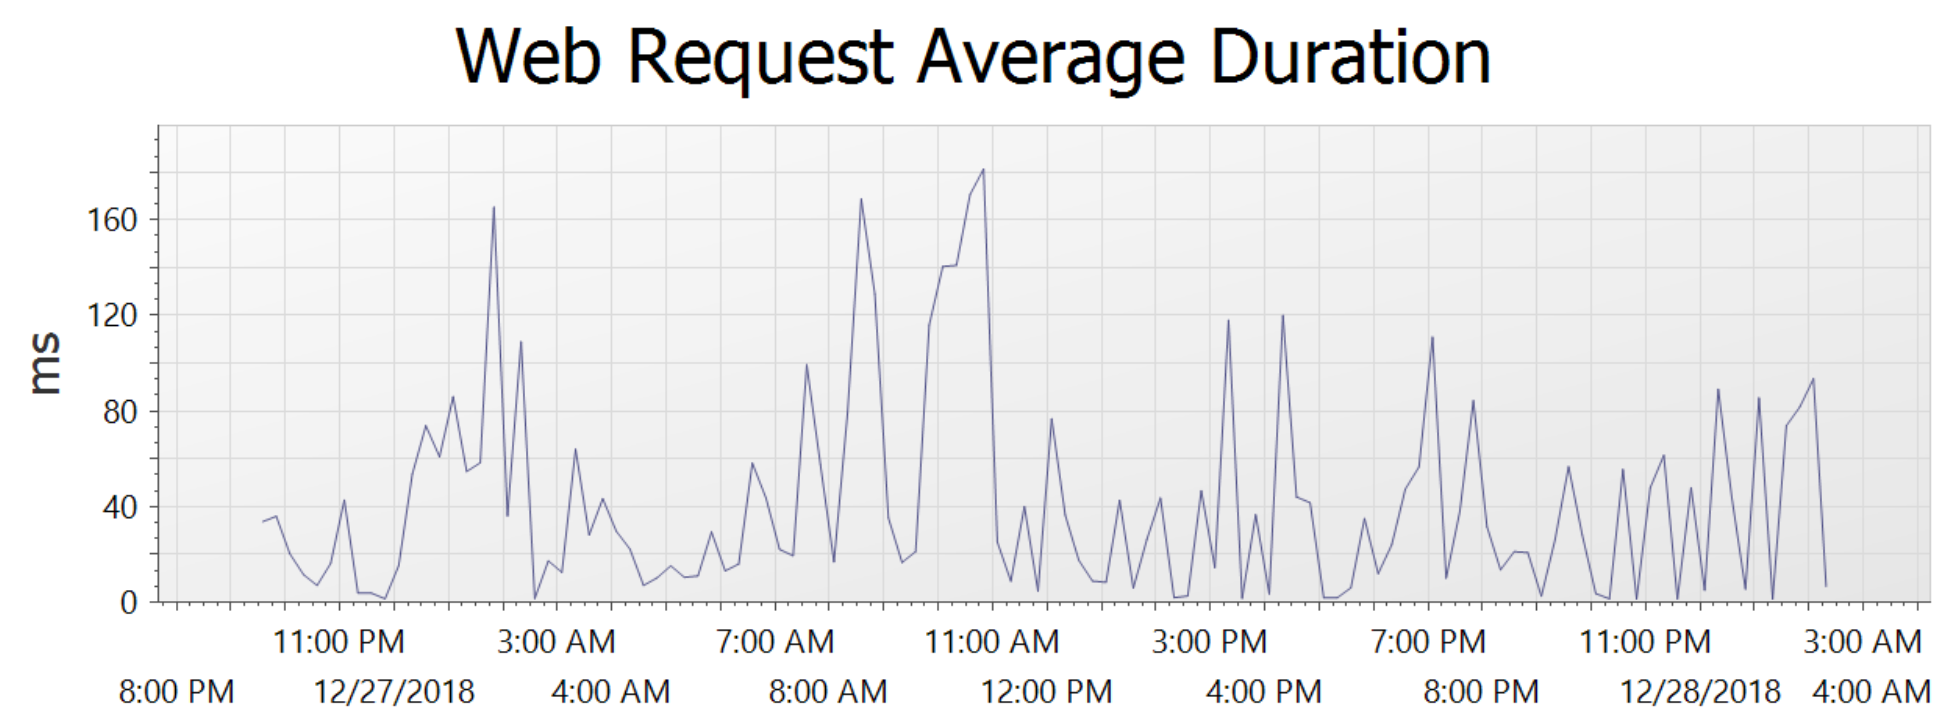
When you graph an event metric you see the value over time, automatically normalized to the time scale you want to view. Here’s an example for a metric tracking web hit performance:
Capture with confidence
Once captured by your code, Loupe metrics are written asynchronously and in a thread-safe manner to ensure the smallest performance footprint possible. While performance will vary depending on the capacity of the host, even a modest host has been rated to capture thousands of metrics per second with no negative impact to the client application.
Take advantage of Loupe’s excellent log and telemetry viewer for Java, all for free - get started with Loupe today!