Loupe Agent for Entity Framework (Beta)
The team working on Entity Framework 6 has made our job a whole lot easier with the latest EF 6 Beta - thanks to the new built-in logging interception capabilities. We’ve published both to NuGet and to GitHub our newest Agent which you can add to your EF projects to get a wealth of diagnostic and performance info where it matters most - in production.
Adding the Agent
There are only two things you need to do to get capturing Data:
- Add The Agent from NuGet
- Register the Loupe Agent with Entity Framework.
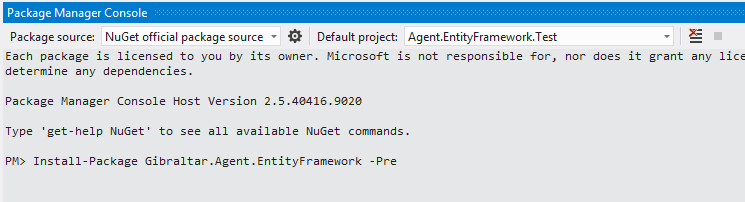
Because the Agent is in beta (and depends on EF beta) and it has no release predecessor it won’t show up in a simple NuGet Search. Instead, it’s best to use Power Shell from the Package Manager Console. Just do this:
Install-Package Gibraltar.Agent.EntityFramework -Pre
Your Packager Manager Console will look like this before you execute the command.
We recommend selecting your top-most project in the Default Project combo (e.g. your web site or application) to associate the agent with since it’ll pull in the Loupe Agent as well.
Once you’ve added the Agent all you need to do is register it with Entity Framework so it will start listening to requests. This is just a one line command which can be done any time in your application (and if called multiple times is safe).
//Register the Interceptor
Gibraltar.Agent.EntityFramework.LoupeCommandInterceptor.Register();
After this call is made any EF call in your application domain (that’s using EF 6, of course) will be recorded.
What’s in the Log?
Every EF call records at least two things - a performance metric and a log statement at the start of execution. If the call throws an exception you’ll also get a message at the end with the result information (logged as a warning so it’ll show up as a Loupe Application Event).
Here’s an example of an insert run by Entity Framework as part of saving changes:
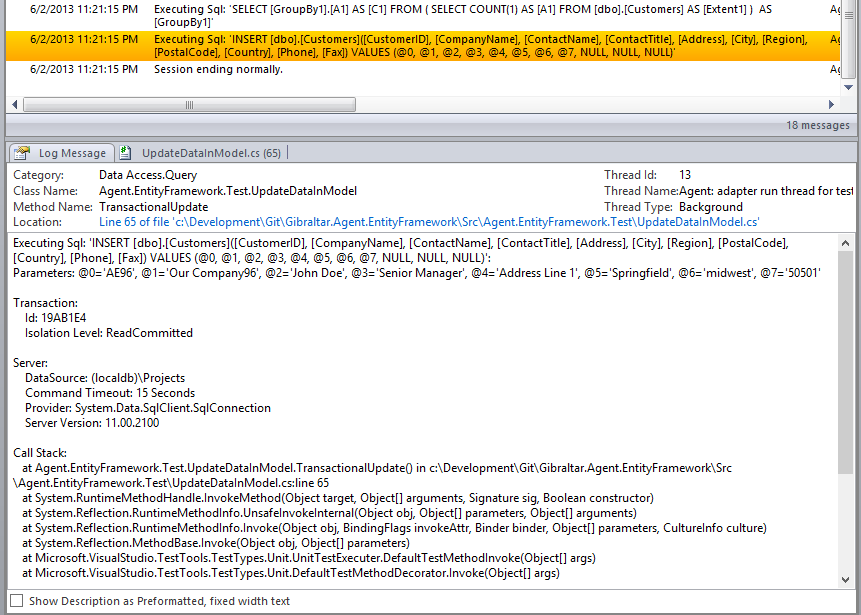
You can see that by default we record the full query, parameter values, information on the transaction (so on a busy system you can see what statements were really part of the same transaction, even if there are multiple operations on the same thread concurrently) as well as the server and call stack that got you there. You can turn off the call stack if you like, but it’s particularly useful when attempting to figure out why your database is getting spammed with unexpected queries.
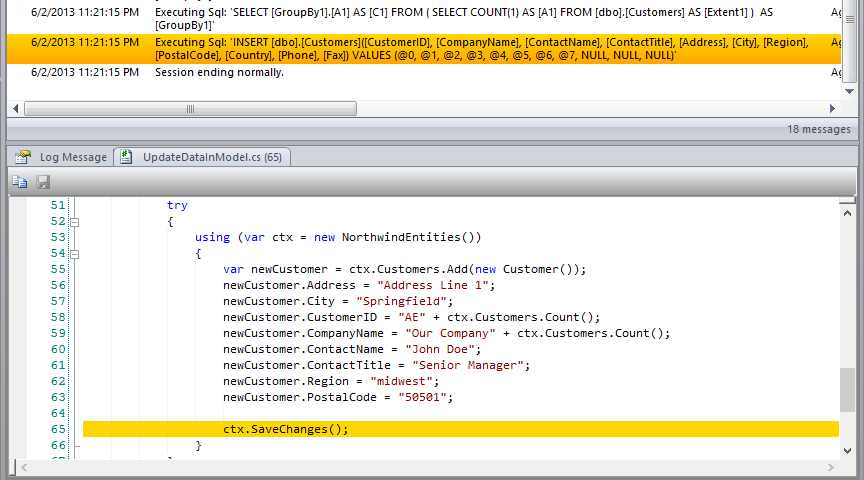
The agent works to attribute each database operation to the part of your source code that triggered the operation. In the case of the example we’re looking at (right from our unit tests) we can see that it correctly attributed it to the save changes call in the unit test. Since I have the source code on my machine I can even see the exact line
Charting Performance
Since we’re recording metrics as well as logging queries we can use the metric graphing capability of Loupe Desktop to show us what queries are executed most frequently or taking the most time.
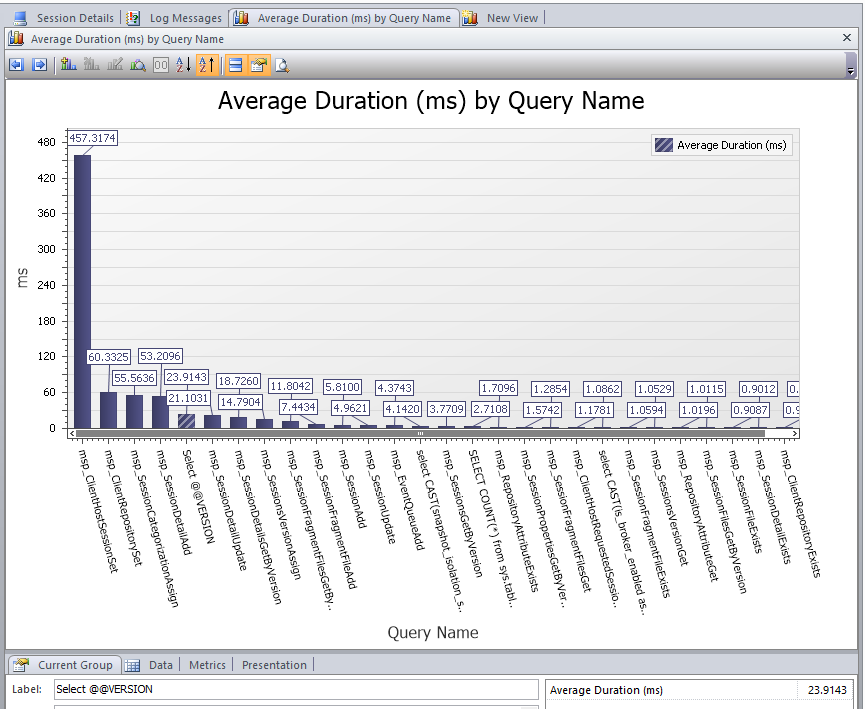
To generate this chart, in the Log Viewer of Loupe Desktop:
- Click On New View
- Click on New Chart to select a charting view
- Drag the Database-Query metric onto the new view which will raise the Create Metric Chart dialog.
- Select to chart the Average Duration. If you have a lot of database operations you may want to limit it to the top 10 or 20 values.
And there you are! No fuss, production-ready information on all of the database calls you’re making!
And You Can Help!
If you’d like to see more, or even help out then check out the Open Source project on GitHub. This is part of our push to make the source code for all of our platform agents available to you so if you’d like it to do something different you can fork it and make the change. Even better, send us a pull request with your improvement and see your code shipped to the whole world as part of Loupe!