Loupe 4.5 Released with New Log Viewer for Web
Loupe 4.5 Released with New Log Viewer for Web
Our latest release of Loupe is now available with a powerful new log viewer integrated into the Loupe Web UI. We’ve spent months working with beta users to ensure our first version is genuinely useful, easy to discover, and yet still fits into our web UI philosophy of not overwhelming users with data.
If you self-host Loupe Server you can download the latest version now to get this and other enhancements. If you’re using Loupe Cloud-Hosted then we’ve done all the work - you just need to log in to the Loupe portal to check out all the new capabilities.
Browsing Logs
You can read an entire log from start to finish by navigating to the session and selecting the Log tab. The log is loaded incrementally as you browse through it so even massive sessions can be read. Based on feedback from Loupe Viewer and Loupe Desktop, the log viewer will show up to the first six lines of the caption & description of each message. You can see the entire message (including XML/JSON details, source location, and exceptions) by double clicking the message or clicking the expand icon on the right.
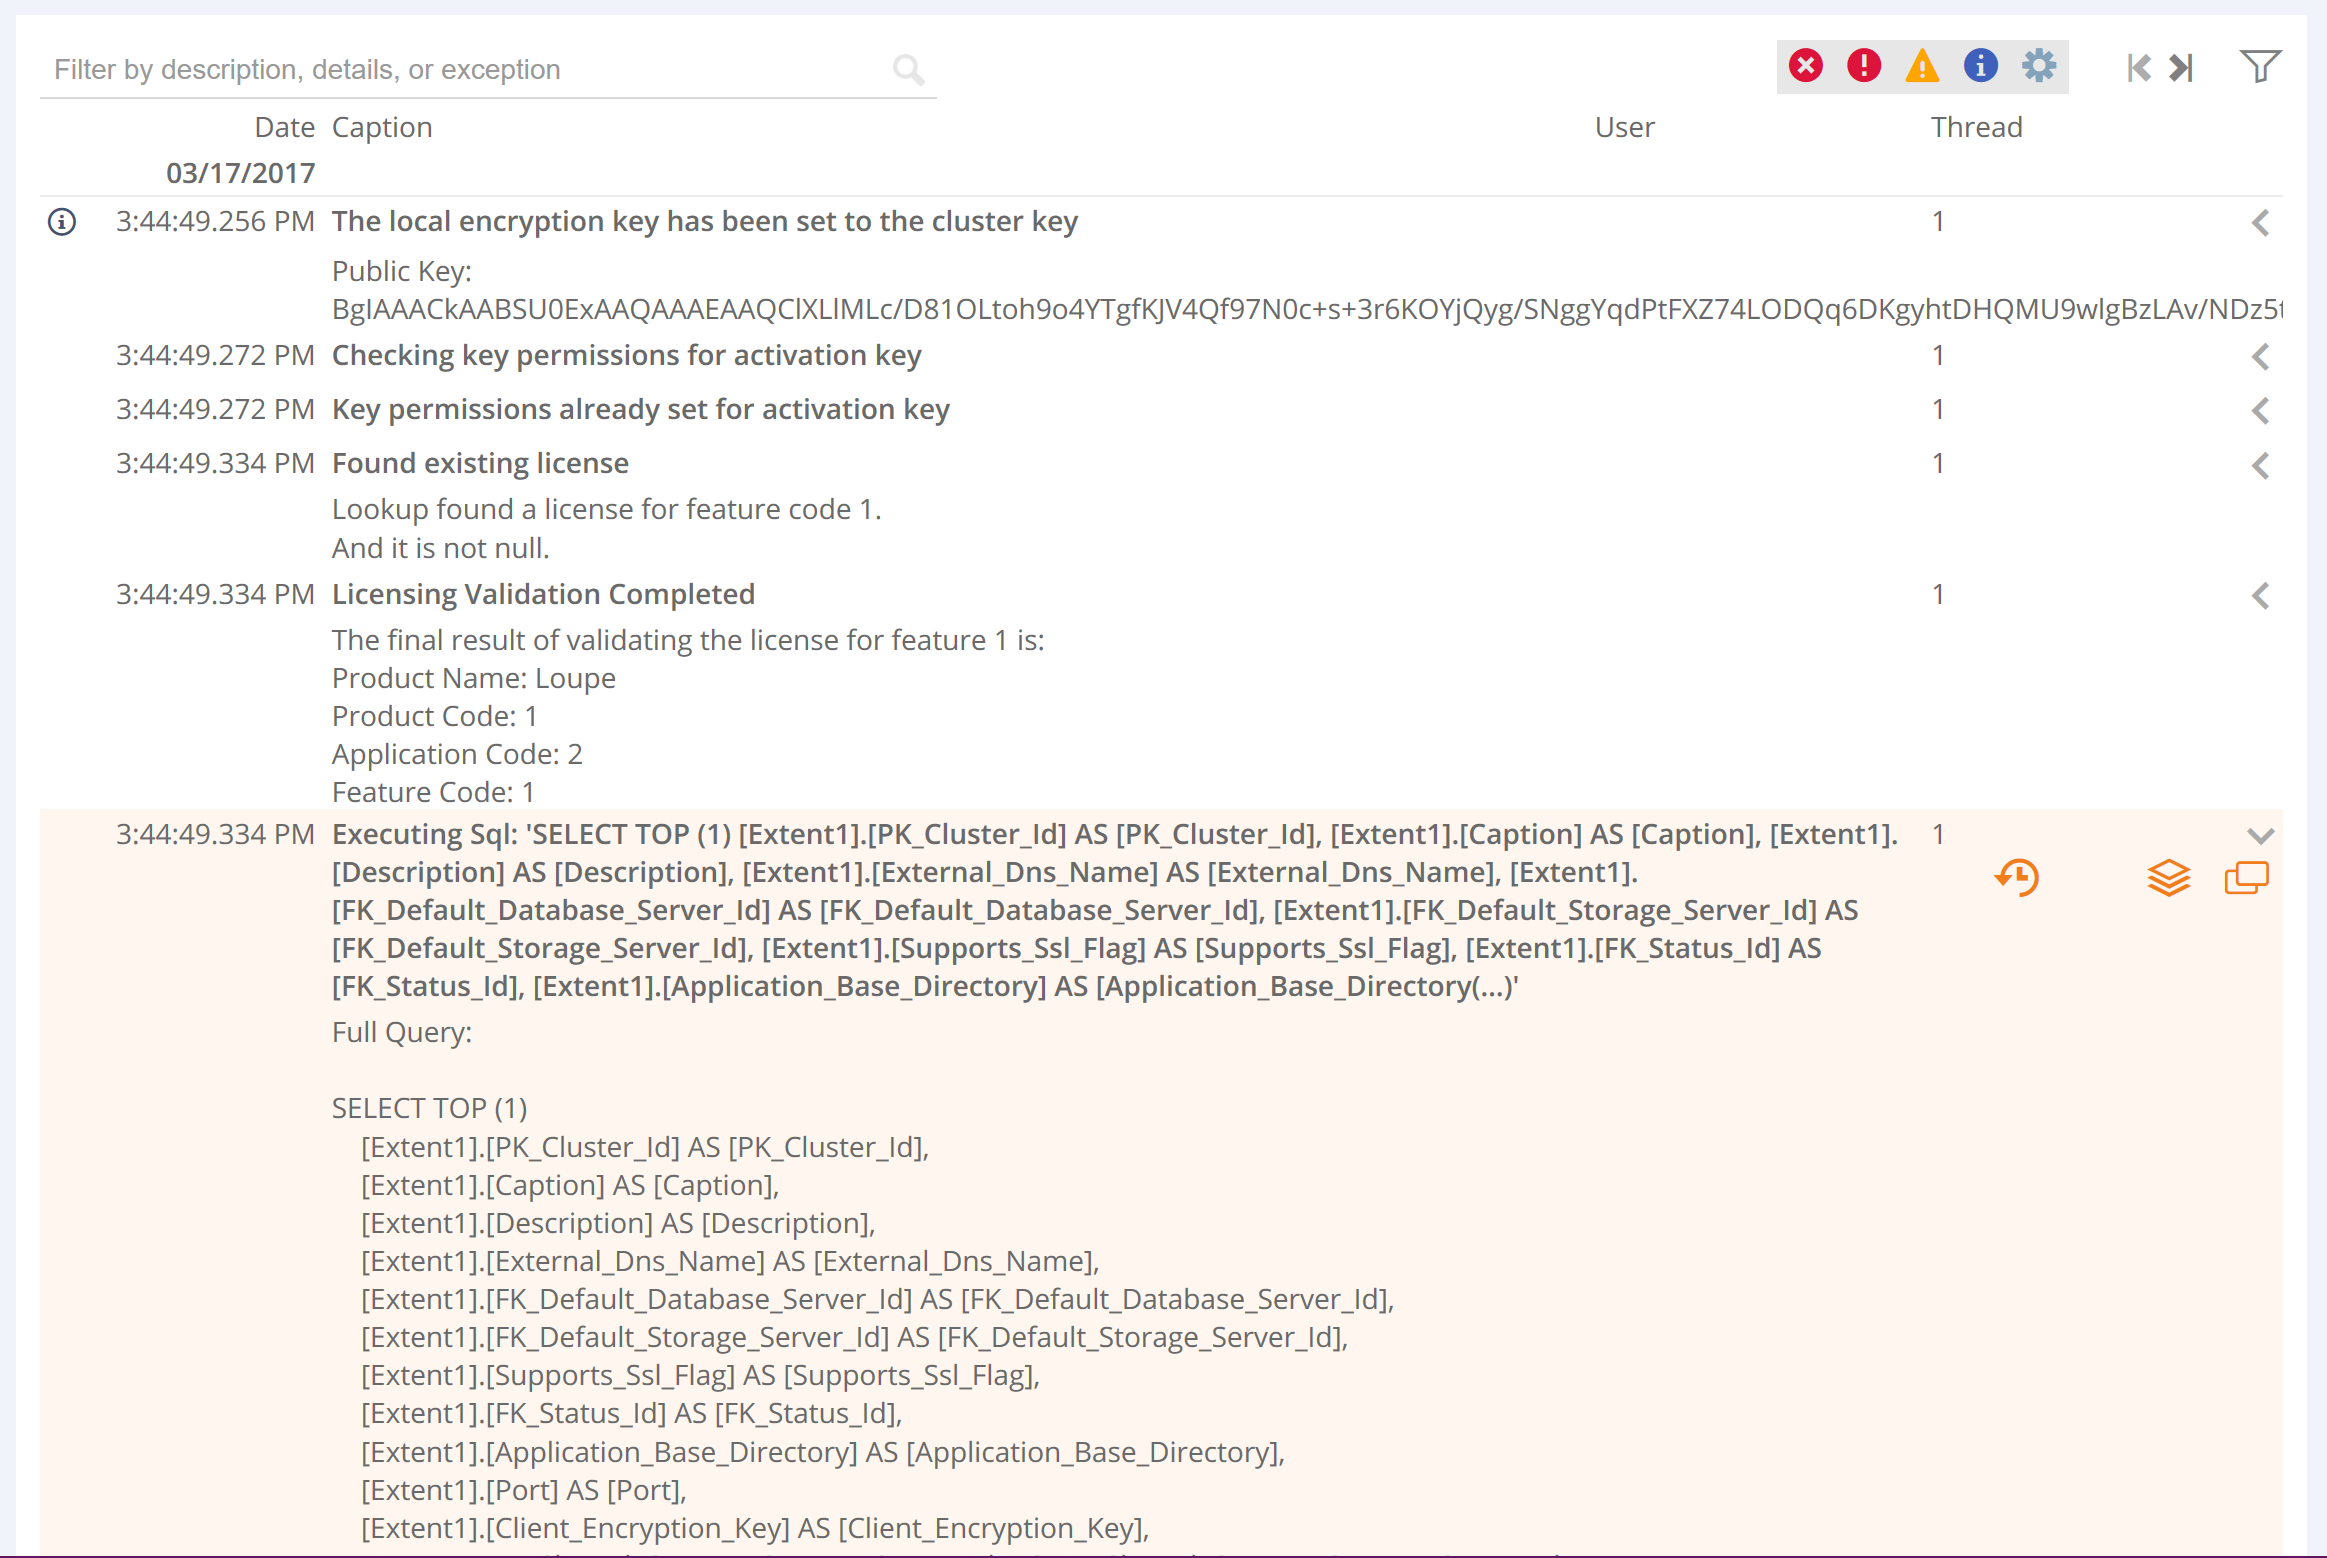
When you select a log message you’ll notice several action items show up allowing you to:
- Open in a New Window: Get a special full-window view of just this one log message, complete with a permalink to make it easier to reference a log message in email or your team messaging.
- See only log messages like this one: This filters the log to just messages that match using the same algorithm used for grouping warnings and errors.
- Navigate to the Event: For warnings and errors you can navigate to the Event related to this message, where you can then create an issue out of it, see all other occurrences of the same error across any number of sessions, and add notes about the event.
New Exception Viewer
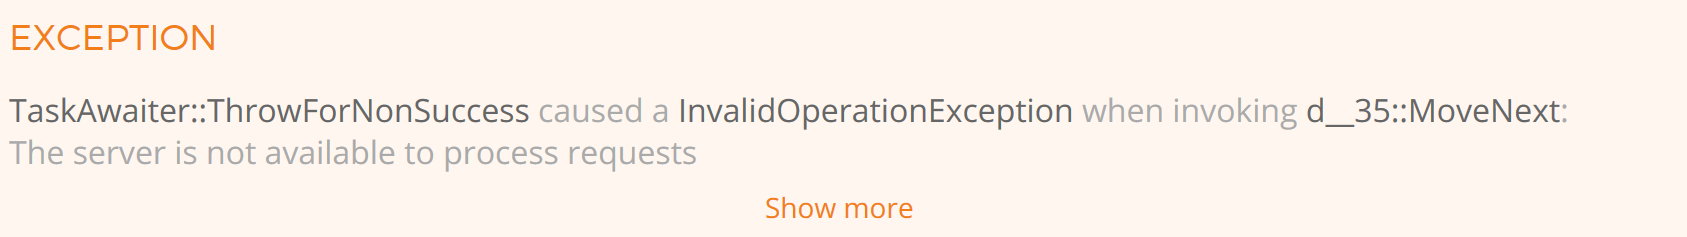
Making a great, useful exception viewer requires some artful tradeoffs. On one hand, an exception message and stack, particularly with inner exceptions, is a big pile of text with a lot of useless information. So, if we can hunt out the critical point of the exception - the part of the application code most proximate to the exception - we can give you just the key bit of information you need to solve the problem, like this:
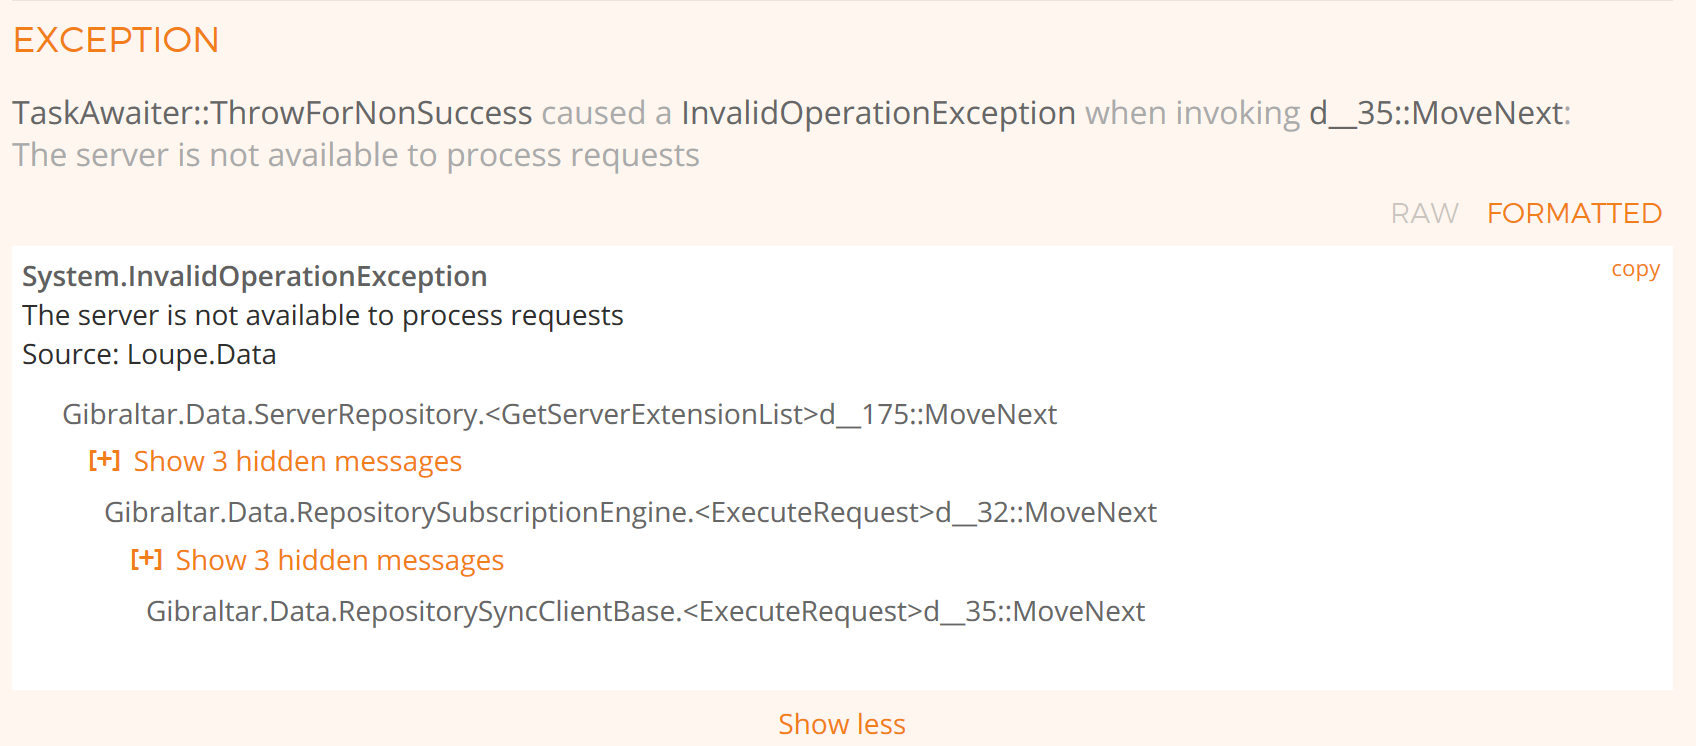
On the other hand, sometimes it’s not that clear and you want to see the inner exceptions and important stack frames so you can better understand how your code got into the error. Even then, there are a number of call stacks that just aren’t interesting (like the async/await state machine and message pump) so we collapse those by default, like this:
Finally, some developers can have a strong preference to want to see the raw data exactly as it would be in the debugger. We don’t want to get in the way when we can’t add value, so we also have a raw view of the exception that you can even copy and paste into an external tool if you have obfuscated the call stack.
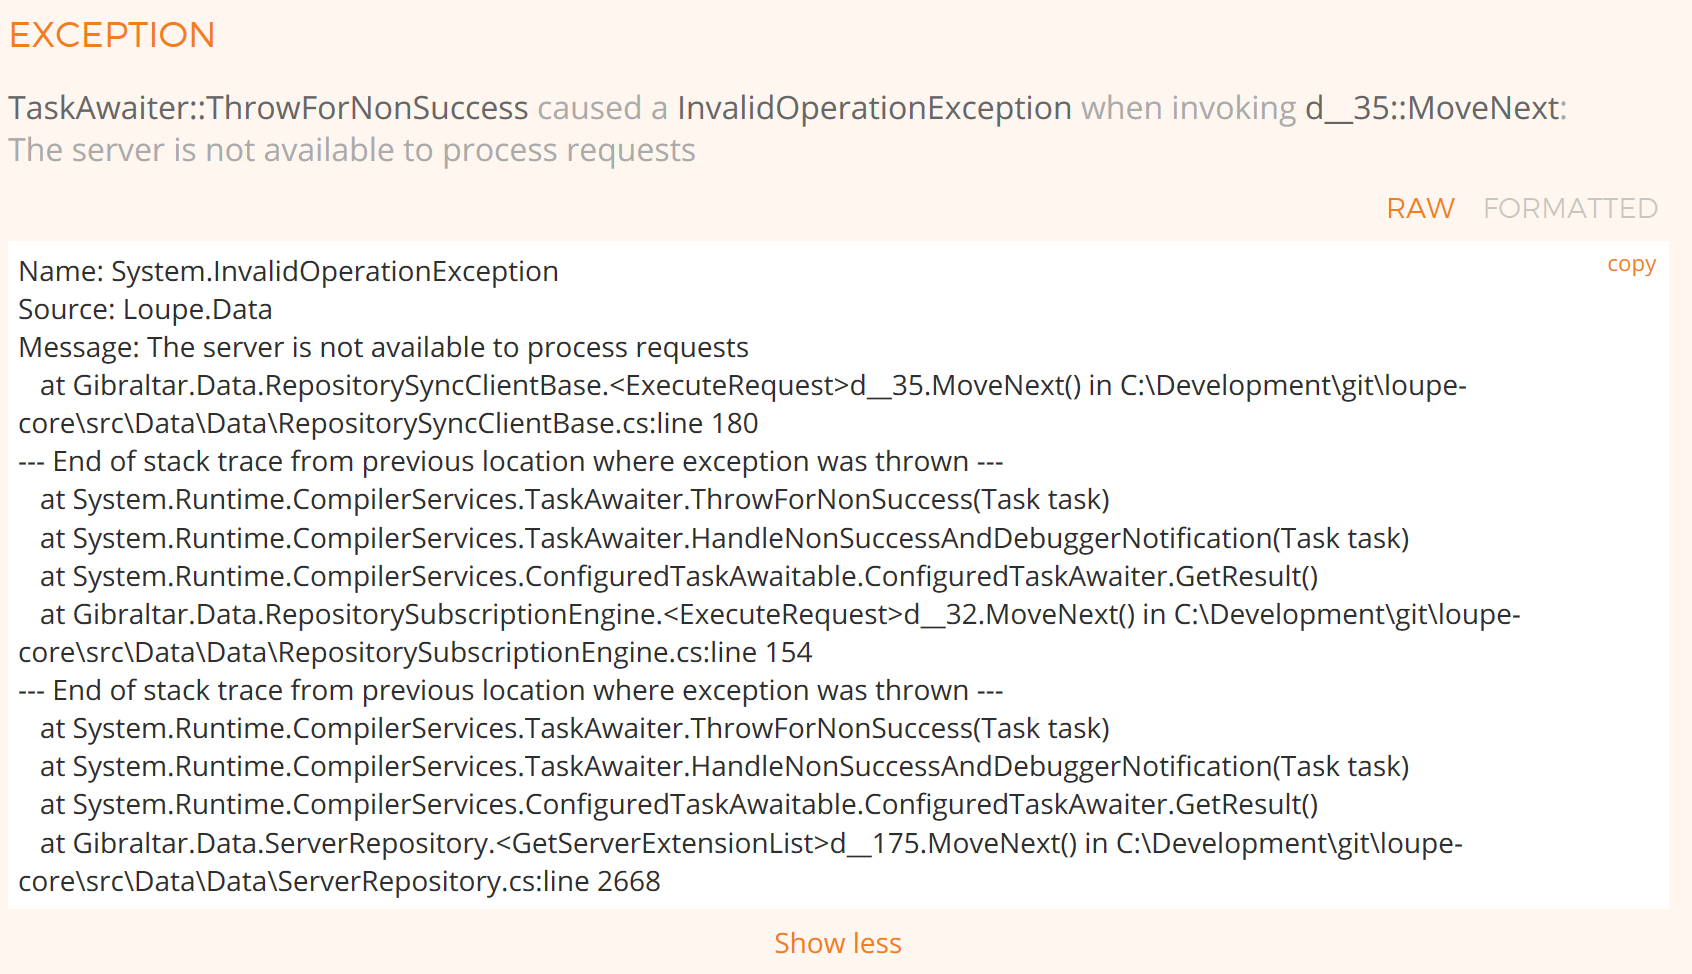
If you’re the kind of developer that always wants to see the raw call stack, no worries - we’ll remember your preference and show it by default next time.
See What Lead Up to an Error
So you’ve drilled into an error and can see that definitely something’s gone wrong, but what lead up to this problem? When you expand the error you’ll see the option to view Previous Messages, which show all of the log messages that are likely part of the same activity leading up to the selected error.
This is particularly useful when an error is the result of another warning or error, helping you zoom in on the root cause quickly. You can then easily jump to that event and open an issue to track this problem to resolution.
Filter by Timeframe, Severity, User, and Text Search
For a large session, browsing the entire log file just doesn’t make sense. To help out, Loupe supports filtering by severity (e.g. show only errors & crashes), timeframe, user, thread, partial message category, and finally a free text search.
Looking for all messages related to an order number? Just put the order number in the log search box and we’ll look for any message with that in the caption, description, details, or exception.
Direct Access to Log Details by User and Event
Throughout the Loupe UI there are now links to take you into the related log, filtered by the criteria of the view you’re on. For example, if you search for a user and see they experienced an error, you can go directly to the exact error messages for them - the log is filtered by their user and the signature of that error. You can then back out and see all message for them in the same session, or all users that got the same error.
These links make the log details one click away from most views, just look for the “view log” link or click on the message counts in the UI.
Loupe Desktop Updates
We haven’t just been focusing on Loupe Server, we’ve hit some important points for Desktop as well. The most notable change is that Desktop now exits when the main window closes by default instead of closing to the system tray. Closing to the tray made sense before Loupe 4.0 when the Desktop had to download and analyze data from the server. The new server API introduced in 4.0 enabled a much more complete integration which eliminated the need to do that extra work locally. Instead, this behavior just seems confusing to users so we’ve changed it by default.
We’ve also made a number of small changes to enhance the integration between Loupe Desktop and Server, for example making it more clear that removing a session now permanently deletes it from the server for everyone instead of just removing it from the local list. We’ve improved the behavior of Desktop when it can’t authenticate to the server to keep it from locking users out when passwords get changed and improved the startup performance when opening a server repository on a busy server and corrected a few scenarios where the Desktop UI would not update in a timely manner to reflect new server data.
New Search and Queuing options for Enterprise
We’ve migrated Loupe Cloud to use Azure’s Platform-as-a-Service features wherever possible, including Azure Service Bus to replace SQL Server for queuing and Azure Search for full text search, replacing Lucene.Net. If you have Loupe Server Enterprise Edition you have the option of doing the same - just configure how you want each cluster to work using Loupe Server Administrator. If you have access to Azure these options provide better scalability and are simple to maintain.