Loupe 4.0 - Your Loupe Dashboard Brings it All Together
Every development team working with a range of data sits back at some point and says “You know what we need? A Great Dashboard. Yeah, that’ll help everyone out!” It seems so simple in concept - bring together summary data from across the system into one view - but more often than not the end result isn’t genuinely useful and after an initial “ooh! Shiny! new!” reaction it fades into obscurity.
When we had completed the detail functionality for Loupe 4.0 we focused in on a problem that we were seeing from our beta community: users weren’t discovering most of the new features, and when they did discover them it was often down a long path. For example, to get to our new application version adoption information they would go into an application, find an event, go to a computer, find the session, and click on the version. Some of this was addressed by making more cross-connections but in the end we knew we needed the first screen users landed on to touch each functional corner of the system:
- Issues & Events: It should prompt people to get engaged with open issues and the event triage process which is critical to getting the most value out of Loupe
- Applications: You may have a number of applications sending data to Loupe, but not all are interesting to everyone.
- Application Versions: Far from just a data attribute, versions define the timeline for an application. For software shipped to third parties the adoption and transition between versions is a key story.
- Sessions: Often they’re just a means to an end, but it’s also great to see that sessions are coming in and getting checked to have confidence in the system.
- Getting Started: You might be the trailblazer for your whole team with Loupe, or a new member of the team that’s been using Loupe forever. Either way, you need to get grounded on what it’ll take to do your job as quickly as possible.
Focus on Your Applications
For each application you’re interested in we want to provide an edge of each major feature. Here’s what I see each day:
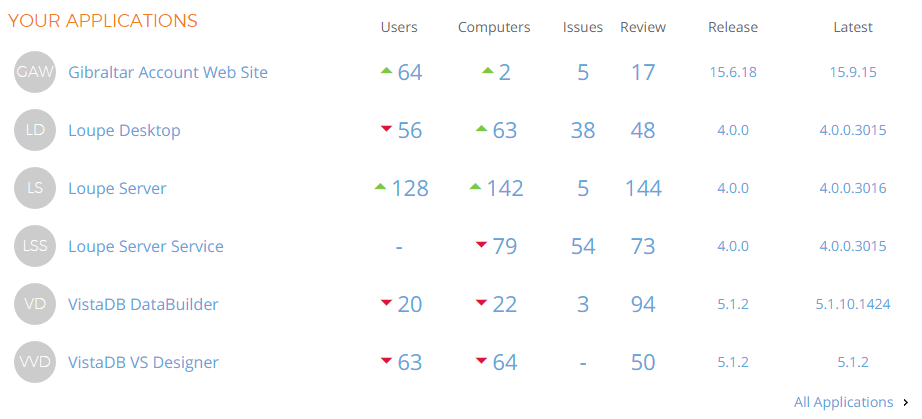
We do this by showing the open issues, events for review (because we really want you to stay on top of these!) and most important usage information: the number of unique users and computers. The trend arrows for usage give us a quick snapshot of whether we’re going up or down.
In addition to the usage and issue information, we wanted to highlight the latest application version information. There are two versions that generally matter to folks: The current shipping version (“Release”) and the very latest version. Drilling into either of these versions would tell you the adoption of the latest release and where the very latest version is being used. Having both of them also subtly demonstrates that the system is aware of different types of release (we call them Release Types) and that it wants to know about Releases.
So, how do we pick what applications show here? The primary way is by having you pick which ones you’re interested in. We did this previously and moved these favorite applications to the top. What that doesn’t address is the key scenario of a new user to the system or a situation where new applications have shown up. To help with that, we automatically add applications that first appeared in the last two weeks. This minimizes the work when you’re first trying to get Loupe integrated with your application and minimizes surprises. If everything else falls through - like for a new user for a system that’s been running a long time - a helpful message is provided to prompt the user to pick some favorites from the All Applications list.

See the Latest Problems
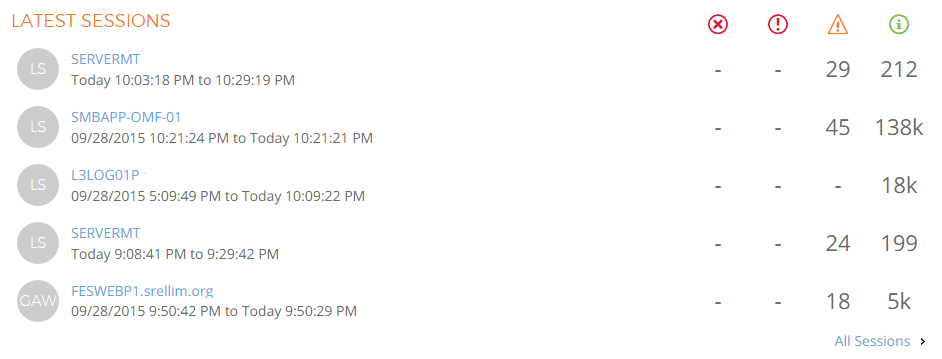
People don’t generally access Loupe just for fun, out of idle curiosity. There’s usually a specific reason - understanding what to work on next, how to fix a problem you’re already focused in on, or trying to provide rapid support. The first set of scenarios are handled well by the Your Applications area, but the last is different. If you’re trying to handle a problem happening right now you are interested in the last information that’s come in. This is where the Latest Events view comes into play.

The critical information is all right here - the caption and severity are the most prominent to make it easy to scan for something that feels right. When you see something that looks suspicious, you naturally focus on the computer and environment (if available). If you have found what you’re looking for the next obvious question is - have you fixed it? Is it an active issue or something new? No problem - on the upper right of each item you find the issue and its status, if there is any.
Often it’s not necessary to filter by application since at any one moment if you’re looking for a problem, it’s likely there. But, the application is available just in a compact form. The badge form here just has the initials of the application but will match the badge and name displayed in Your Applications if you’re not sure.
Depending on how fast events are coming in for your user base, you might just see a few minutes of issues (like in the image above). You can go farther back in time by clicking All Events which takes you to the dedicated view of latest events.
Know You’re Receiving Data
There are two other questions that commonly come up - are we receiving data and what’s just come in from a particular environment or computer? If everything’s going well you won’t see anything in the Latest Events area (because there are no events) so how do you know things are running smoothly? Of course, you can search for a specific computer which is great if you’re hunting down a problem or providing support but it’s great to just be able to browse and see that sessions are arriving, everything’s going well.
Find Things you Worked on Before
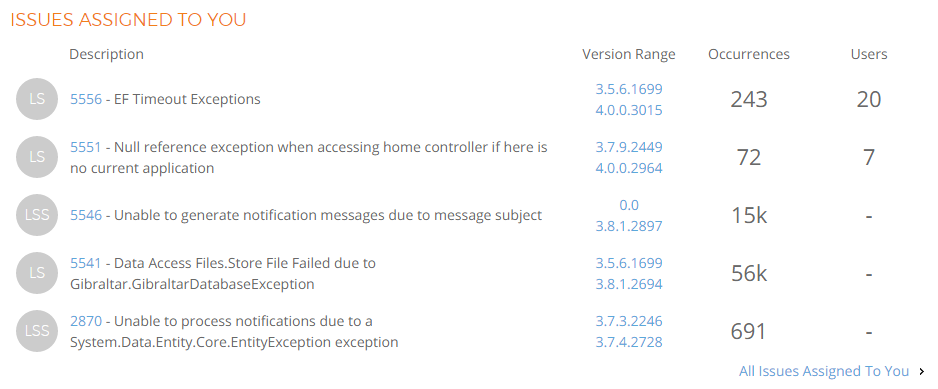
If we haven’t already pulled in the information you’re looking for higher up, the most likely reason is you’re trying to find either something that’s been assigned to you (an Issue) or something you were recently looking at so you can pick it back up. That’s why we end with the latest issues assigned to you and the most recent sessions you’ve looked at.
For each issue, our new card view is optimized to present the key information to select an issue while leaving enough white space to not let them run together. By default, issues that affect the most users sort to the top.
For each session, we show the computer and timeframe as the main content and then a compact summary of the volume of messages recorded by severity. As we’ve done before we use a small badge for each application to save space and reduce visual noise.

And Keep it Current
Every one of the views on the dashboard automatically update as data changes. This is particularly handy when you’re suspicious of a problem and are just monitoring, waiting to see if something pops up. You’ll see an orange highlight as data values change.
That brings it all together - a personalized overview of the data in Loupe highlighting the most likely, essential information for you and keeping you up to date. We’re confident that it either has the information you want or you can get there with just a click or two from it.