It's More than Just Exceptions and Errors
One thing we often debate back and forth internally is how to strike the balance between tracking errors and exceptions and providing broad, general diagnostic capabilities. There’s a lot of basic attention paid to tracking exceptions - and a lot of tools that can help you do that. Certainly, each exception that gets reported to an end user is a problem and you should address it (even if that’s just to make a better catch & report dialog). But, what about application problems that either aren’t exceptions or can’t be solved with just the exception detail?
We recently released Gibraltar 2.1. During the several month preview program we used Gibraltar to gather detailed data about how the application was running and what problems users were encountering. Our Agent tracks exceptions and errors but also a lot of little details. This data got reported back to us automatically using the Hub each day after the application exited.
For each exception that got reported to us we looked at:
- Was this a distinct problem, or part of a cascade?
- Could we determine the root cause from the exception report alone?
We broadened our definition of exception to include any single error log message to include things that could have been expressed as a single exception. This is particularly important since Gibraltar supports logging exceptions as extended data on any log message severity and supports recording errors that aren’t the result of an exception. We also counted all of the session summary information (such as operating system, memory, processor architecture, etc.) as part of the exception detail.
What we found is that many of the issues could be solved just from the exception - which is a great step forward from a decade ago where this type of runtime problem information wasn’t readily available. By far, having this information is dramatically better than not having it.
However, most issues required significantly more context to be categorized and resolved- 56% in our case. In a few cases - about 1 in 8 - it would have been possible to recognize cascade errors as long as you knew the exceptions happened in the same process in order. That means 49% of all issues required additional context. In most cases we needed to see several messages leading up to the problem, sometimes a range of them. In about 10% of all issues we ultimately needed data from the performance counters to identify the issue. Most commonly these were memory counters - both for the current process and for the system.
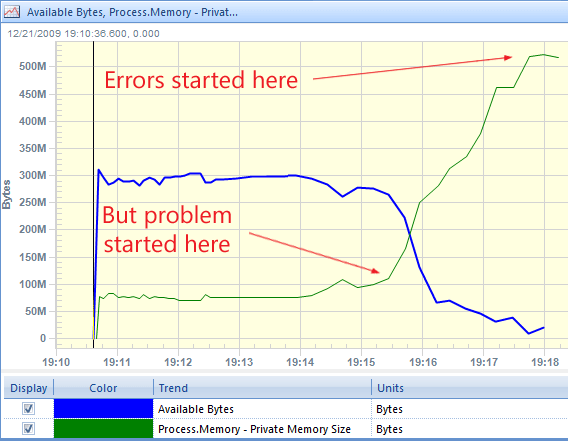
For example, when a computer gets low on memory it will start to experience all kinds of odd errors due to transient memory allocation problems. These can also happen if the current process is simply allocating memory too quickly. The first scenario is not your fault - nothing you can really do about the user chewing up all of the memory with something else. The second scenario is your fault - you need to be able to see the slope of private memory climbing before the problem and track that back to whatever your app was doing up to the point where errors started happening.
Here’s a Gibraltar Analyst screenshot from a customer who had this problem with their application:
In the end, it’s situations just like this that motivated us to design the Gibraltar Agent to be a great logging system, performance monitor, and configuration monitor out of the box. It’s great to get notified of exceptions, but it’s even better when you can fix a user’s issues instead of just better informed that there are problems you can’t nail down.

