How Loupe helped Loupe 2.1 - our CEIP
For us, one of the great things about being the developers of Gibraltar is that, well, we get to use it to support our product and customers. After all, we got into this business because we’re really passionate about software diagnostics. We’ve always had a strong commitment to dogfooding; a term Microsoft uses to talk about using your own products internally before asking others to risk their success. We went through three closed beta cycles before Gibraltar 2.0 shipped - and each used Gibraltar to support itself. Whenever there was an issue we focused on whether we could solve it just with the data we got from our own tool. Many times we couldn’t - so we added key capabilities like the detailed assembly information tracking, culture and time zone tracking, and a host of other little details.
For the past four months we’ve been working on the centerpiece of Gibraltar 2.1 - the Hub Server. We gave the first preview builds out in September and since then have been updating them based on both the feedback of early beta users and our own experience using the Hub as part of our new Customer Experience Improvement Program (CEIP). Since starting the program we’ve received detailed logs on thousands of Gibraltar sessions from around one hundred users (folks that elected to use the Gibraltar 2.1 preview builds).
How it Worked
To implement our CEIP we needed several things:
- End user consent: Before gathering anything from end-users we made sure they knew and agreed to what was going to happen. For the beta there was a simple notification that to participate in the beta you had to opt in to the CEIP. Otherwise, go back and install the latest release version. For production we have a much nicer opt-in / opt-out system.
- Application runtime monitoring: Exceptions, logging, feature usage metrics, performance counters, and other information about how the application was performing were collected automatically by the Gibraltar Agent. This information is stored locally on the end-user’s computer as the application runs.
- Background data transfer: runtime monitoring data was periodically transferred from the end-user’s computer to a central server. This was done entirely in the background using a resumable, HTTP-based protocol. This is a feature built into the new Gibraltar Agent when working with the Gibraltar Hub.
- Central analysis: As data was submitted, summaries and detailed information were sent down to the development team for analysis. This uses the new integration between the Gibraltar Analyst and the Hub. In particular there are a few key reports built into the Analyst designed to dissect application errors and usage information.
Fortunately, this is just want we designed Gibraltar for.
By The Numbers
We did two broader beta releases of Gibraltar 2.1. For each we tracked all of the issues that were found post-developer. This could be by our internal QA processes, reported to us by end users, or only found by analyzing the CEIP data.
The key question we wanted to know is how much better would our product because of the CEIP? In other words, how many improvements could we make based solely on the automated CEIP feedback, not information from any other source. We were actively engaged in talking with our beta users as well as actively reviewing our own internal testing and information. So to justify itself, it’d have to find real improvements that didn’t also come in from those sources.
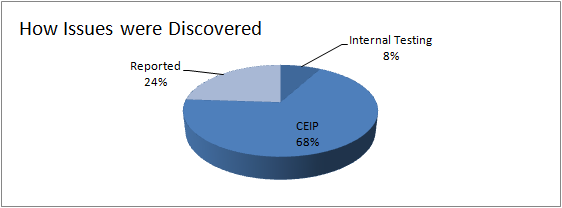
Combining the results, here’s how the issues were discovered:

At first glance, a few things jump out:
- Internal testing didn’t find many issues: Our post-developer QA processes didn’t find many things we didn’t already know about (We eliminated known issues from these charts that we elected to ship the beta with). More on this below.
- CEIP beat customer reports 3 to 1: The CEIP was the biggest single contributor. It points out that even in this audience of select customers they didn’t report most issues they ran into.
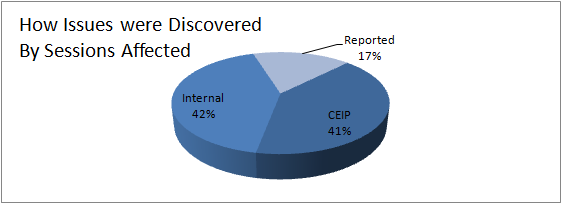
Now, not every issue happens with the same frequency. When you weight each issue by the number of end user sessions that it affected we see a very different distribution:
In this case our Internal testing fared better, indicating that while we knew or identified few issues internally they reflected the most common issues. The ration of CEIP-identified issues to Reported issues also improves to almost 2 to 1, indicating that end users are reporting the ones they are running into most frequently.
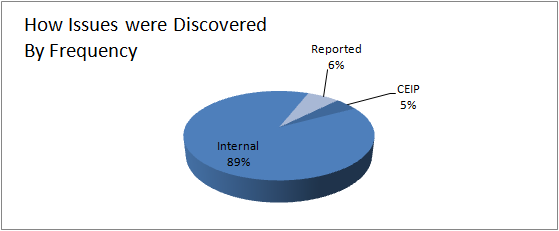
Finally, if we look at the number of issues weighted by occurrence, even if they occur many times in the same session we see:
So this validated that our internal testing overwhelmingly knew about the most frequent problems, but the CEIP to Reported ratio now is nearly 1:1; Users are reporting issues that they run into multiple times in the same session substantially more than ones that happen sporadically. This makes sense if you consider human nature: If you run into the same problem five times in one session you’re likely to be pretty annoyed and more likely to send off a comment than the one freak occurrence.
What does this say about a CEIP?
Look back at the charts above and imagine that each slice marked “CEIP” was labeled “Don’t know we Don’t know” - each reflects something that today you don’t know about, and worse don’t have any way of knowing you don’t know about it.
We focus on the middle chart as our true measure of reliability - issues weighted by number of sessions. This gets rid of the funny outliers where a user persisted in running an application that was in a bad state and kept experiencing the same problem repeatedly or issues that tended to cause cascade failures. In this chart, over 40% of the total issues we would never have known about without our CEIP. This was nearly equal to the issues we found in final QA. Imagine not doing any QA. That’d sound ridiculous, right? Well, the CEIP found the same number of problems.
We were honestly surprised by these results, because our mental image was the third graph: We knew about all of the problems. But, this view was skewed because we were unconsciously weighting against the volume of each problem. What we found through our CEIP are all of these little boundary issues, and these are the little things that separate an OK product from one that your customers can count on - one that Just Works.

