Gibraltar 2.5 New Feature Dive - Viewing Sessions
We previously mentioned that one of our key goals for Gibraltar 2.5 was to scale up. For the session viewer we wanted to handle larger and more complicated sessions. For example, we have customers that routinely generate sessions with several million log messages and others that are using metrics aggressively and want to chart a few hundred metrics at the same time.
Message Paging
The biggest problem with millions of messages is memory. Gibraltar Analyst is a 32-bit process which means it’s going to fail if there’s more than about 1.5GB of RAM allocated at any time. Of course, we want it to use the least memory possible but we can’t exceed 1.5GB. After some memory profiling it was clear that displaying the messages was more memory intensive than loading the session data itself.
We sampled a set of data from our own sessions and customer-provided samples and determined that over about 250,000 messages the value of browsing and dynamically filtering more messages is more than offset by the performance impact. In Gibraltar 2.5 any session with more than 500,000 messages will get split into pages of 250,000 each.
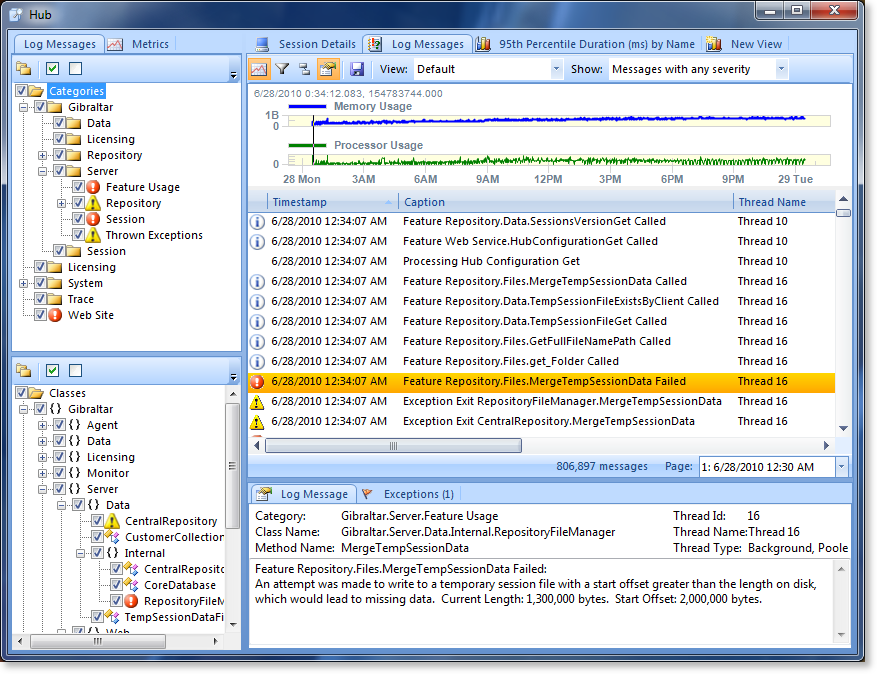
We’ve added a status bar to the bottom of the log messages grid to provide additional navigation context as you work with log messages, including paging information:
You can jump between pages, and there’s an overlap of messages so if you are working on an issue right at a boundary between pages you don’t have to keep hopping back & forth.
How Many Messages?
We’ve always shown you how many messages were recorded for a session, but not necessarily what you have access to. Why would there be a difference? The main reason is due to data pruning in the agent when a session runs for a very long time or generates a lot of data. If the session hits the pruning rules you define it won’t all be there. Now we show how many messages there are at any time:
And update that if you start filtering to reflect the filter:
Anyone got the Time?
Many times you only need the approximate time and absolute order of log messages to follow what’s going on, but some times (like when understanding the performance of your application or understanding the exact timing of external events) you need as much detail as possible.
Just pick any set of messages and the total duration of the selection is displayed in the status bar (unless it’s zero). The accuracy of the time is still limited to the resolution of the source clock , so you’re unlikely to see values less than 16 milliseconds.
You can also switch the grid to display the full time in milliseconds instead of using the default time format for the current culture (this feature was added in 2.1.1).
Chart Many Metrics
If you’ve been using the Gibraltar Agent for PostSharp, or done’ your own event metrics, you may have run into an annoyance that it can generate a lot of distinct metrics. For example, we use the Gibraltar Agent for PostSharp to inject metrics into the Gibraltar Hub - and we get a distinct metric for each web service command and database call.
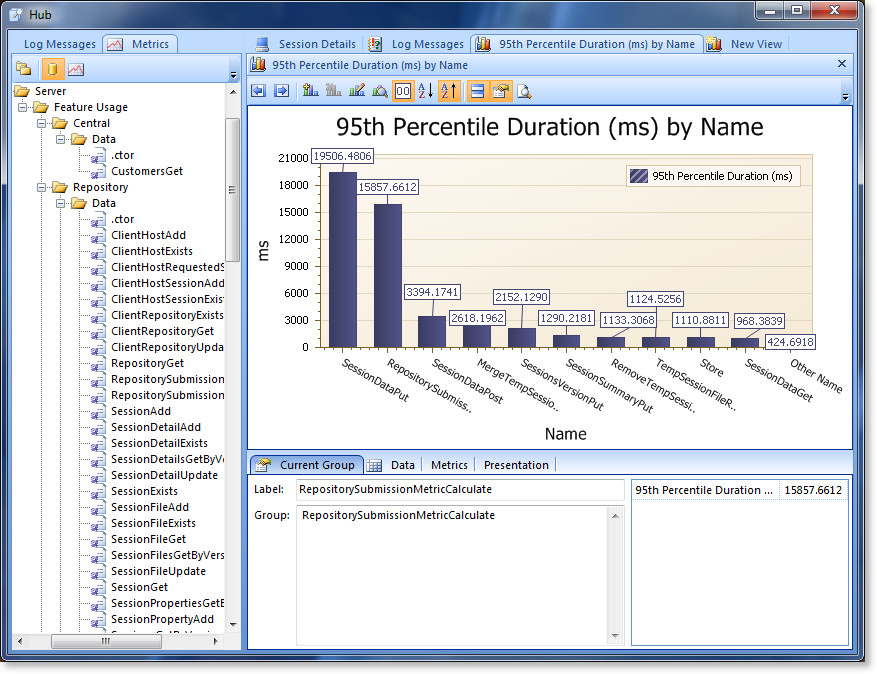
When we want to chart these to, say, find the top 10 time consuming database calls it’s annoying to have to add them one-by-one to the chart. It’s slower and it causes the chart to keep recalculating after adding each metric.
Now you can drag & drop a whole category of metrics into the chart and add them in one go. It’s faster, less error-prone, and lets you get answers fast to common questions. Now the choice of whether to record everything under one metric or make many metrics isn’t driven by these limitations. We have customers that generate thousands of metrics and this optimization as well as a few others related to it really improve the experience.
This actually demonstrated some other performance challenges when we created a few extreme data sets - with two million events in thousands of metrics and then start dynamically manipulating the chart, well, things can slow down. We’re confident if it’s usable at these sizes, it’ll be fast enough for your situation.


