Using Gibraltar for Simple ASP.NET MVC Performance Monitoring
Behind door 7, we’re looking at performance monitoring and how you can easily use to Gibraltar to help track your application performance.
If your customers complain to you about your website being slow, your first question needs to be “Define slow”. It means different things to different people and in website terms it can cover a multitude of issues: slow loading, slow response, slow in the browser, slow on the server, slow only on this page or in that feature. And even when narrowed down, how do you tell what slow actually means? To answer that you need numbers, because these give you a baseline to work from, a way of measuring what slow means and if it changes when you modify code.
Using Gibraltar to help with this is easy. Start with NuGet and add the Gibraltar Agent for PostSharp, which will also install any other required libraries. Then, find the code you need to measure and add the GTimer attribute to any methods you need to measure, or to a class if you need to measure all methods in a class. For example:
[GTimer]
public class AccountController : Controller
{
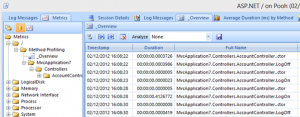
Once you run your application and the session details are available in Gibraltar Analyst, you can view your measurements in the Metrics section of the session.
Here you can see that with just one additional attribute, you can track exactly how long each method takes. If you needed a narrower focus, figures within these methods, then you could manually add tracing to help with the measurements.
To find out more about automatic measurement of you applications, read up on using PostSharp with Gibraltar in our documentation where we have complete details on using PostSharp with Gibraltar. In later blog posts we’ll expand more on instrumentation and how Gibraltar can help you measure your application performance.
