Super Useful Perf Counters
Well, Rachel’s wit and charm is a tough act to follow, but I wanted to kick-off our Christmas Advent calendar with a little treat about the Windows performance counters Gibraltar collects automatically and how you can use them to identify memory leaks and other problems in your .NET apps.
If you’ve ever used Microsoft’s PerfMon utility, you’re already familiar with Windows Performance Counters and know how useful they can be in understanding system performance. That is, if you already have it running at the time you need it! You probably don’t, but no worries — Gibraltar has you covered. Gibraltar automatically and efficiently collects the most common and useful perf counters in every log session so you’ll have that data available for analysis after the fact.
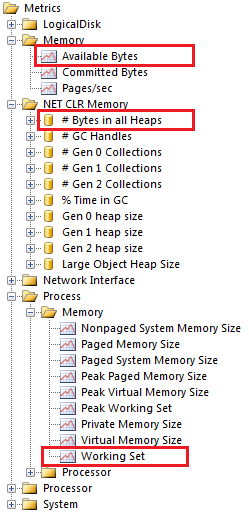
Three particular counters I wanted to point out to you today are:
- Available Bytes - Physical memory available on your system
- Working Set - Physical memory being used by your process
- # Bytes in all Heaps - Virtual memory allocated to your process by the .NET CLR
These counters can give you a good idea of whether your process is leaking memory, and if your program is slow, they can tell you whether your process is thrashing because of it’s own memory consumption or memory pressure imposed by other processes on the system.

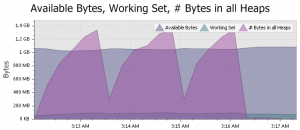
This graph shows objects being allocated from the heap with minimal impact on physical memory because the objects are being paged out to disk as virtual memory.
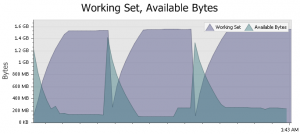
For example, take a look at these two graphs. The first graph below shows a process that iteratively consumes then frees all available memory.
The second graph below shows a different process with a similar pattern of memory allocations, but the allocated memory is being paged out to disk.
You can find more details on specific perf counters in Microsoft’s doc, but the key point is that Gibraltar ensures that this crucial information is available to you when you need it.
Stay tuned for more tasty tips on Gibraltar and VistaDB every day between now and Christmas.

