Loupe Agent for ASP.NET Core
Following on from our earlier post about the Loupe Agent for .NET Core, in this post we’ll look at the new Loupe.Agent.AspNetCore package, which provides the same kind of functionality for ASP.NET Core as the Loupe packages for ASP.NET MVC and WebAPI offer, including out-of-the-box logging and metrics.
Configuration
The configuration information is the same as before, so make sure to read that section of the previous post. But let’s also look at another option for storing sensitive details, like your Loupe Repository name, that you don’t want checked into source control (yes, even if you do have a private repository): User Secrets.
User Secrets
User Secrets are stored in your HOME directory on your development workstation, and secrets
for different projects are encrypted with different keys. The User Secret configuration provider
is automatically included when your app is running in the Development environment; that is,
when ASPNETCORE_ENVIRONMENT is set to Development. You can manage User Secrets using either
the dotnet CLI, or Visual Studio 2017.
If you are using the .NET Core SDK 2.1.300 or later, the user-secrets command is included by
default. If you are using an earlier version of the SDK, you should really upgrade now: 2.1 is a
LTS release which will be supported for 3 years, so it’s a good release to get onto.
To set a user secret from the command line, first make sure your current working directory contains
the csproj file for your web project. Then run:
dotnet user-secrets set "Loupe:Server:CustomerName" "your-customer-name"
dotnet user-secrets set "Loupe:Server:Repository" "your-repository-name"
To manage user secrets from Visual Studio 2017, you can just right-click on the project in Solution
Explorer and select Manage User Secrets, which lets you edit the settings in JSON format just
like appsettings.json.
LogLevels
You can specify which “levels” of message get sent to Loupe within the standard Logging section
of your configuration. To do so, add a new property called Loupe, and override the default levels,
like this:
{
  "Logging": {
    "LogLevel": {
      "Default": "Debug",
      "System": "Information",
      "Microsoft": "Information"
    },
    "Loupe": {
      "LogLevel": {
        "Default": "Information",
        "System": "Warning",
        "Microsoft": "Warning"
      }
    }
  }
}
With these settings, log entries from types in namespaces starting with System. or Microsoft.
will be filtered to only include Warning or higher; all other entries will include Information or higher.
Activation
This section assumes you are using a standard ASP.NET Core web application created from the MVC template.
There are two places you need to add a bit of code to get the Loupe Agent up and running in an ASP.NET Core application; one for logging, and one for diagnostics (metrics).
Logging
We configure logging in the CreateWebHostBuilder method of the Program class. By setting up logging early,
we can ensure that any messages or exceptions generated while the application is starting up get sent to Loupe.
We use the ConfigureLogging method of IWebHostBuilder to add Loupe logging, like this:
    public static IWebHostBuilder CreateWebHostBuilder(string[] args) =>
        WebHost.CreateDefaultBuilder(args)
            .ConfigureLogging(builder =>
            {
                builder.AddLoupe();
            })
            .UseStartup<Startup>();
Diagnostics
The Loupe Agent for ASP.NET Core supports the new DiagnosticSource system,
described here.
The ASP.NET Core MVC framework produces diagnostic entries using this system, and the Loupe Agent uses them to
generate the metrics you are used to seeing for ASP.NET MVC and Web API applications.
To activate this feature, in the ConfigureServices method of your application’s Startup class, just add:
    services.AddLoupe()
        .AddAspNetCoreDiagnostics();
Usage
Logging
ASP.NET Core provides a very good logging library out-of-the-box; you can find the full source for it at
github.com/aspnet/Logging. Unlike third-party logging systems, including
Loupe’s own Log methods, the Microsoft.Extensions.Logging library is used extensively throughout the whole
of ASP.NET Core and Entity Framework Core, as well as a lot of NuGet packages and other libraries, so you can
get log messages from everywhere without needing to worry about Trace sources and listeners and things like that.
To write your own messages to the logs, you need an instance of ILogger or ILogger<T>. Usually you can get
this via dependency injection (which is also supported out-of-the-box now). These interfaces provide familiar
methods for logging at different levels, from Trace for the most verbose of logs, to Critical for only the
most important messages.
As an example, let’s add logging to an ASP.NET Core 2.1 API controller to record a warning message when a Customer is not found.
[Route("customers")]
public class CustomerController : Controller
{
    private readonly CustomerContext _context;
    private readonly ILogger<CustomerController> _logger;

    public CustomerController(CustomerContext context, ILogger<CustomerController> logger)
    {
        _context = context;
        _logger = logger;
    }

    [HttpGet("{id}")]
    public async Task<ActionResult<Customer>> Get(int id)
    {
        var customer = await _context.Customers.FindAsync(id);
        if (customer != null)
        {
            return customer;
        }
        _logger.LogWarning("Customer not found: {Id}", id);
        return NotFound();
    }
}
You might notice that the LogWarning call looks a bit like a string-interpolation construct, even though it’s not.
That’s because the library supports “structured logging”; it is possible to extract hierarchal data from the log entry
for persistence - For example to route into the Details field
of Loupe log messages.
Bonus Logging Tip
Microsoft’s logging library provides a neat extension to reduce the cost of logging in high-performance scenarios: the LoggerMessage class. This provides some static methods that let you pre-compile and cache delegates to write specific log messages.
Look at the example above. Every time that call to LogWarning is made, two things have to happen that have a cost.
First, the int id parameter has to be boxed and an array has to be allocated because the method takes a params object[]
as its second argument. Second, the message string has to be parsed for interpolation. If your server is running at
high load, or if you have logging on a “hot path” (such as in a loop), that’s a lot of extra work to be done.
With LoggerMessage, you create an Action delegate that pre-parses the message string, and is generically-typed to
avoid boxing values. In practice, it’s a good idea to wrap these in a static class with extension methods on the ILogger
type, and use those for logging; this also helps to keep your messages consistent if you’re writing the same log from
multiple places. Let’s refactor our Customer not found log into an extension method using LoggerMessage.
internal static class CommentLoggerExtensions
{
    private static readonly Action<ILogger, int, Exception> LogCustomerNotFound =
        LoggerMessage.Define<int>(LogLevel.Warning,
            new EventId(4041, nameof(CustomerNotFound)),
            "Customer not found: {Id}");

    public static void CustomerNotFound(this ILogger logger, int id) =>
        LogCustomerNotFound(logger, id, hashid, null);
}
Now our Get action can use this extension method:
[HttpGet("{id}")]
public async Task<ActionResult<Customer>> Get(int id)
{
    var customer = await _context.Customers.FindAsync(id);
    if (customer != null)
    {
        return customer;
    }
    _logger.CustomerNotFound(id);
    return NotFound();
}
Note that the delegates created by LoggerMessage.Define will always include an Exception parameter at the end
Metrics
Although Loupe Agent for ASP.NET Core works with DiagnosticSource for the in-framework diagnostics, you should
continue to use Loupe metrics as before for your own measurements. Loupe has a built-in capability of tracking
nearly any kind of telemetry you might need for your application. We’ve built in a useful set of request tracking
in the Loupe Agent for ASP.NET but you can also do your own custom telemetry. For more information see our guide
on Loupe Metrics.
Sample application
To see all of this in use, you can check out this demo application created by RendleLabs. It’s a lightweight link-sharing and discussion application called, for some reason, Flbbl.
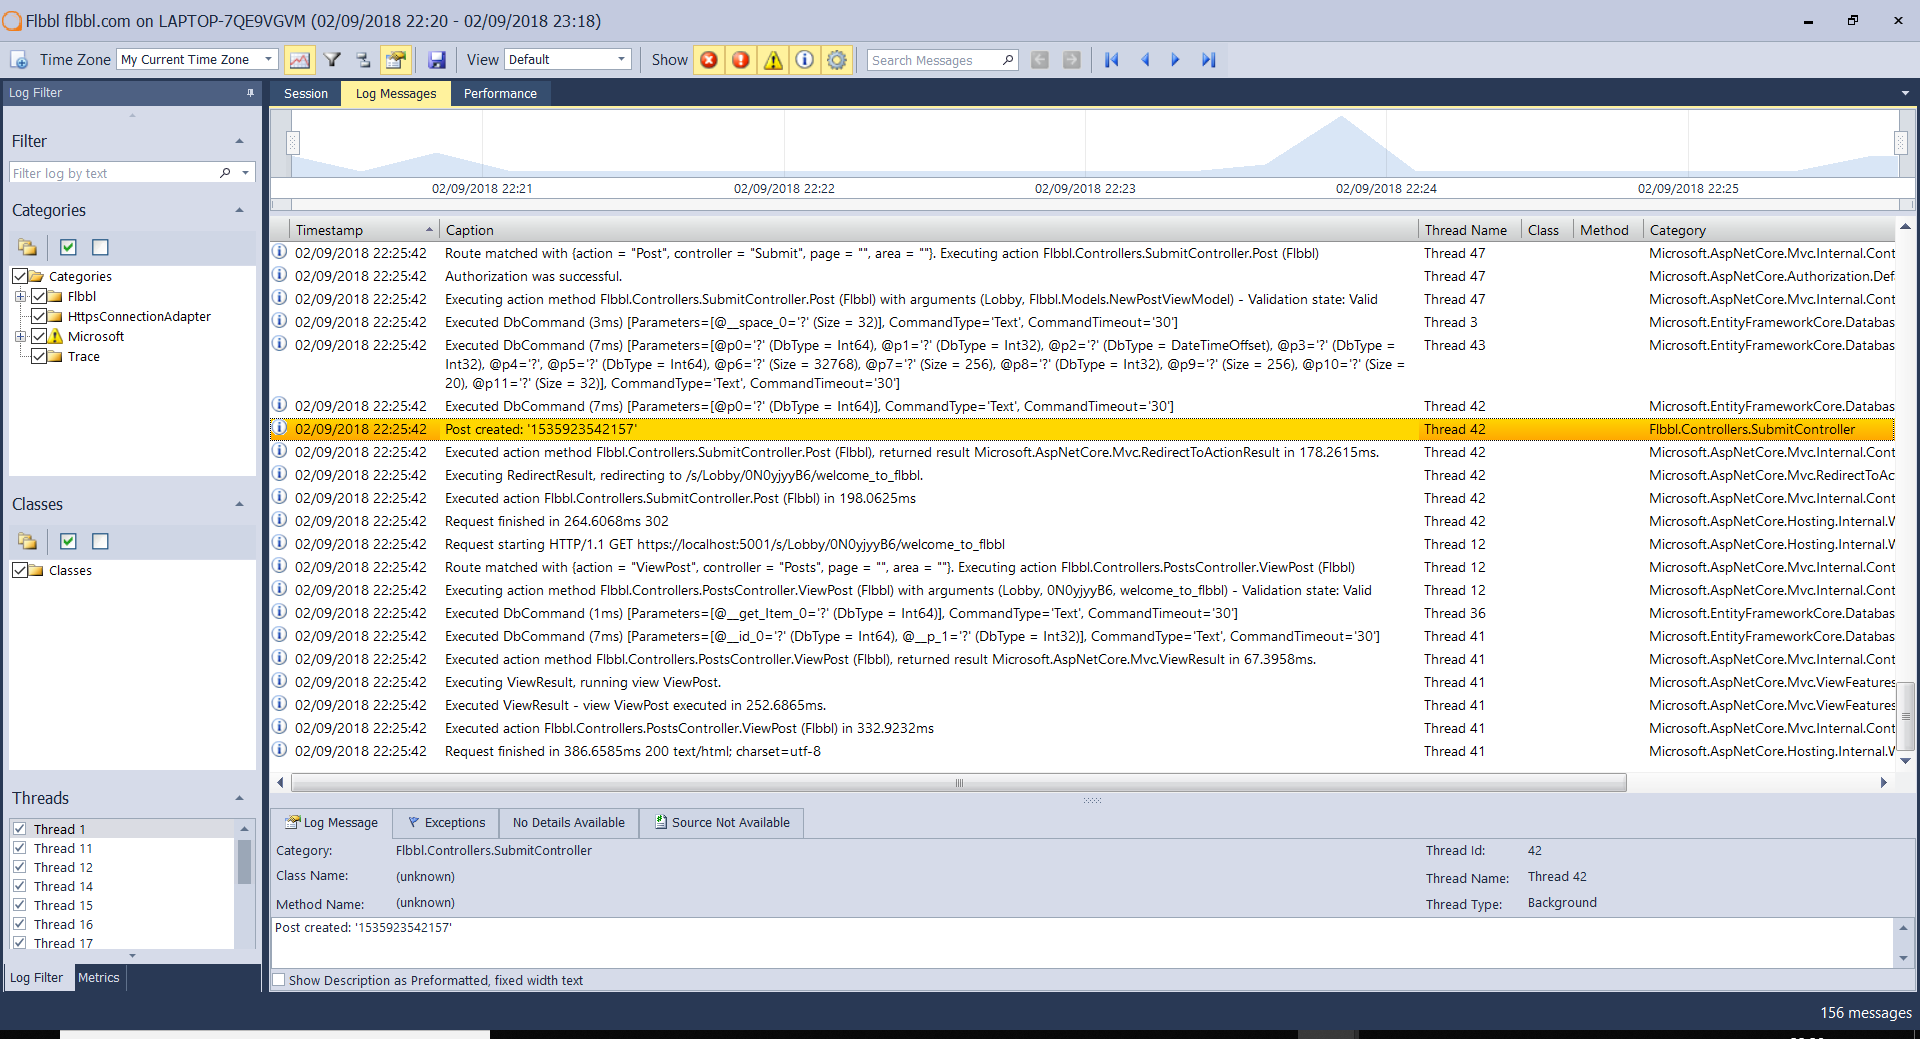
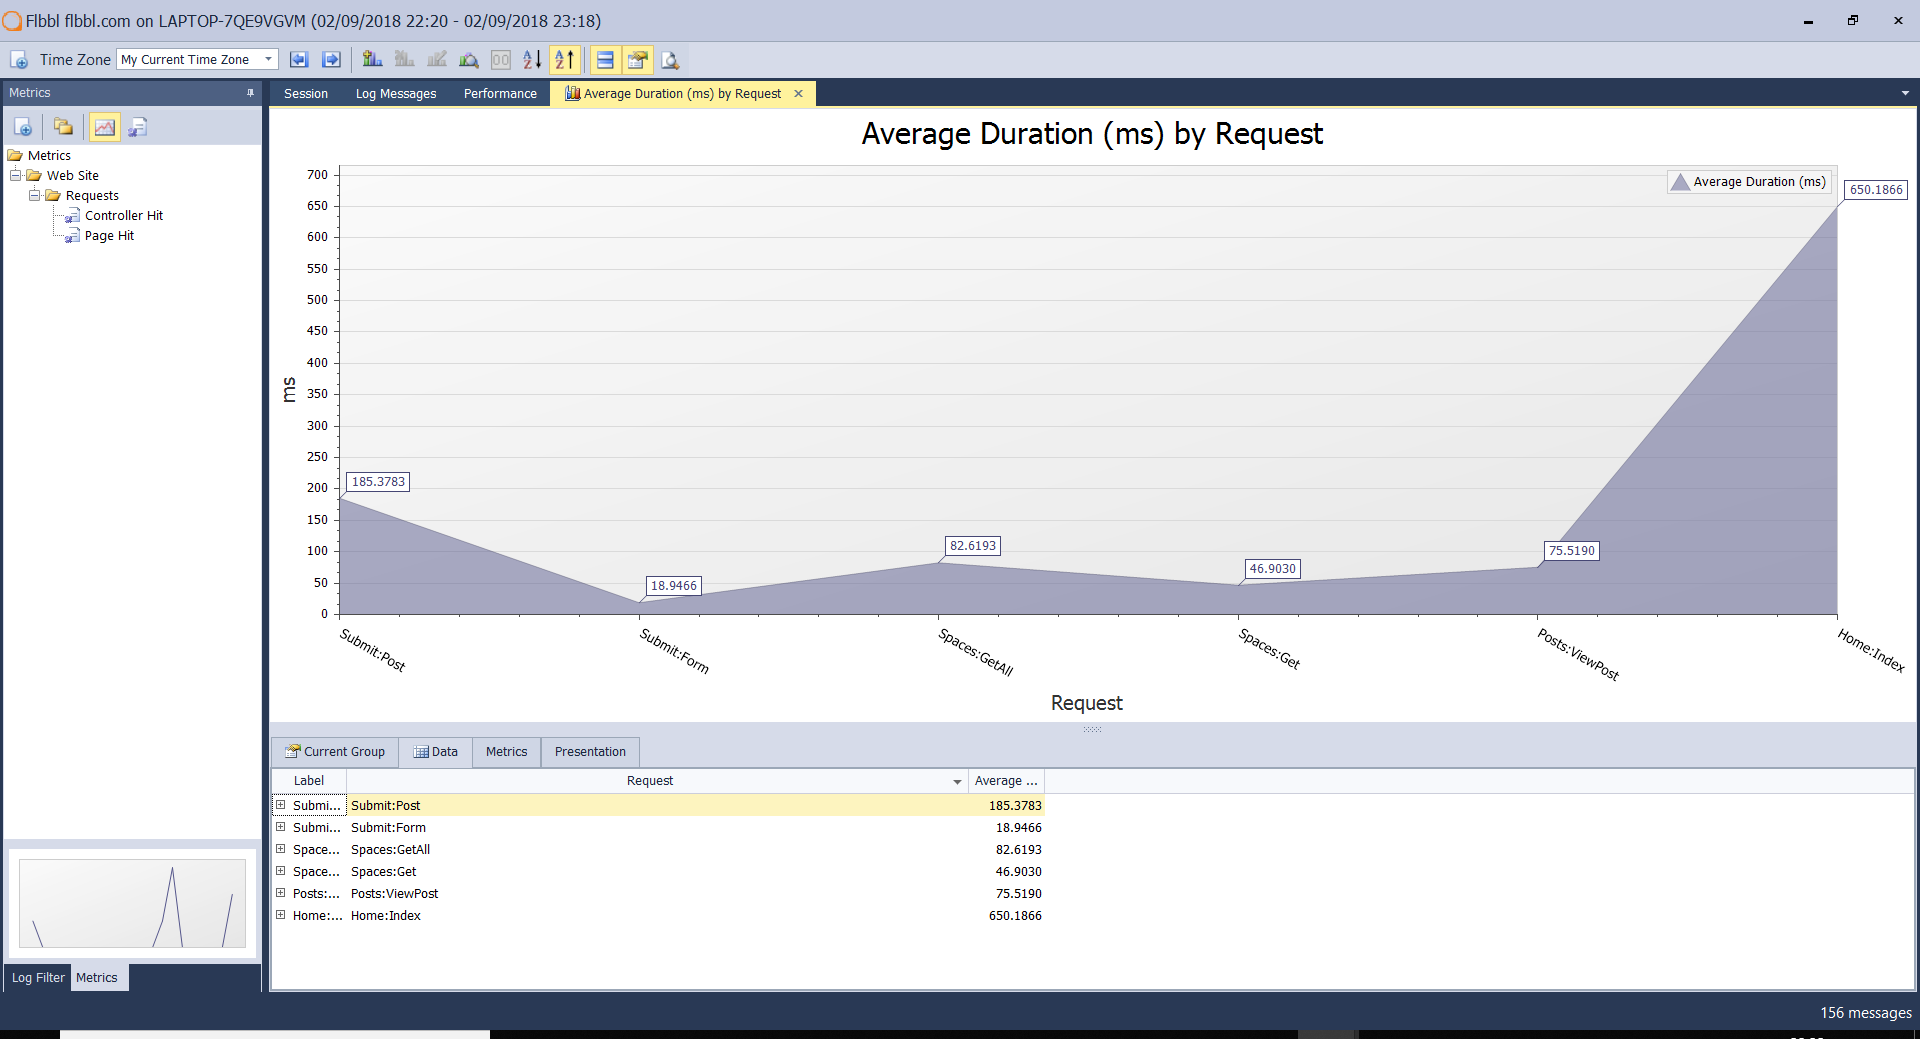
Here are some screenshots taken from the desktop Loupe client showing the log messages and default ASP.NET Core metrics gathered from an instance of Flbbl in Development mode.
As the application runs you can see what gets recorded in the detail log, viewable using [Loupe Desktop]((/local-logging/free-net-log-viewer) or the Loupe Web UI.
Each controller hit also records performance and analytics data so you can perform a range of analysis - from simple checks on average response time over time to drilling into exactly what activities are driving that response time.
What can Loupe Do For You?
You can take advantage of all of the .NET Core features with Loupe absolutely free - The various agents are published to NuGet and the source code is available on Github. Gibraltar Software provides full commercial support for the agents as well as the free Loupe Desktop, so you’re covered. If you’re looking to centralize all of your log data and get more out of it for your team then try out Loupe Cloud-Hosted.
Finally, we don’t just say that we’re open to pull requests - if we can make the agents better for you just log an issue on GitHub or contact our support team and we’ll make it happen!