The Where is as Important as the What
Sometimes where a problem occurs matters more than the problem itself. For example, increased database query times in the production environment is a bigger issue than the same query times in your development environment, and it doesn’t necessarily point to an application defect. But, it can point to a declined service for your live application, and require a concentrated effort to fix. For these kinds of scenarios, we recommend Loupe Monitor.
Loupe Monitor is designed to let you track error and performance metrics in specific environments. So if you are responsible for ensuring steady production operations for your application, Loupe Monitor makes it easy to filter out the data from every other location, and hyper-focus on the locations that matter to you.
Loupe Knows Where Your Application Runs
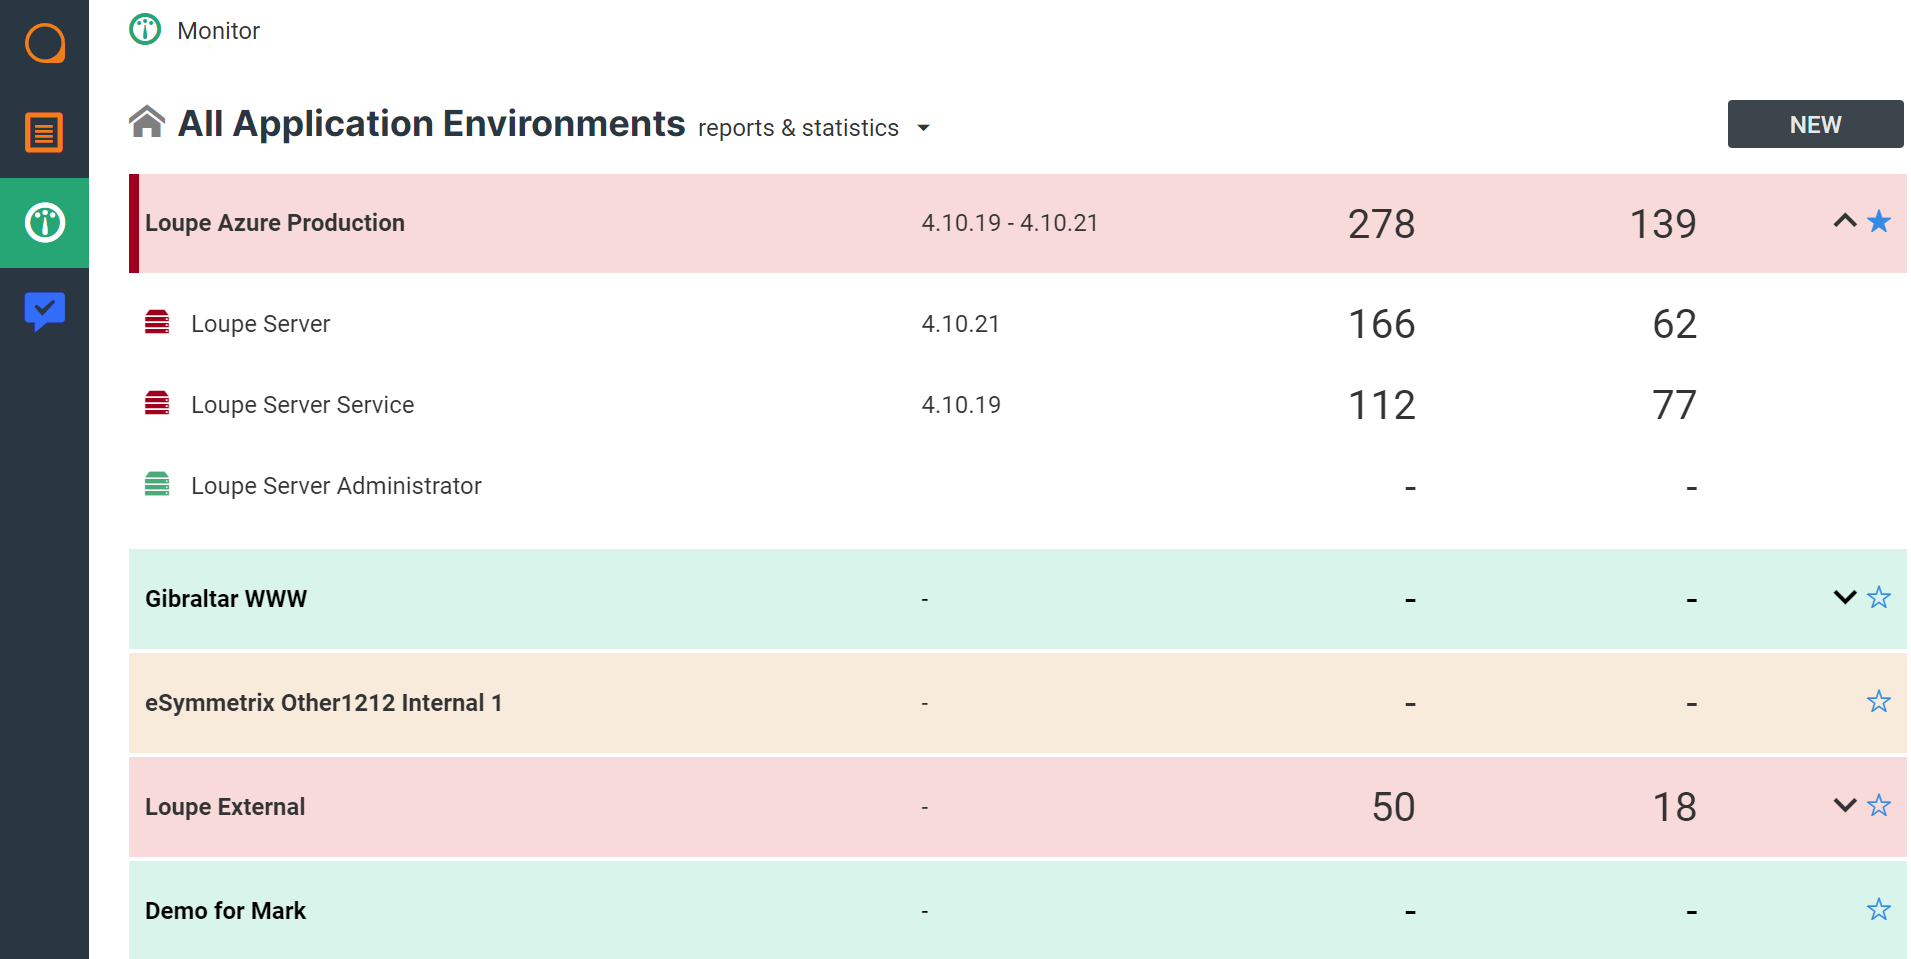
Loupe includes extensive diagnostic data with each log it collects, including information on where your application runs. By default, Loupe will include the name of the machine where the log originated, but you can optionally include an environment name to indicate whether a log came from production, a development server, or any other location where your app runs. Using this information, Loupe Monitor creates a list of available environments and organizes your telemetry accordingly.
You further reduce the scope of environments you personally track by picking favorites. The default Loupe Monitor home page lists your favorite environments and shows a snapshot of their health (active alerts and alerts).

Loupe Collects More than Just Log Messages

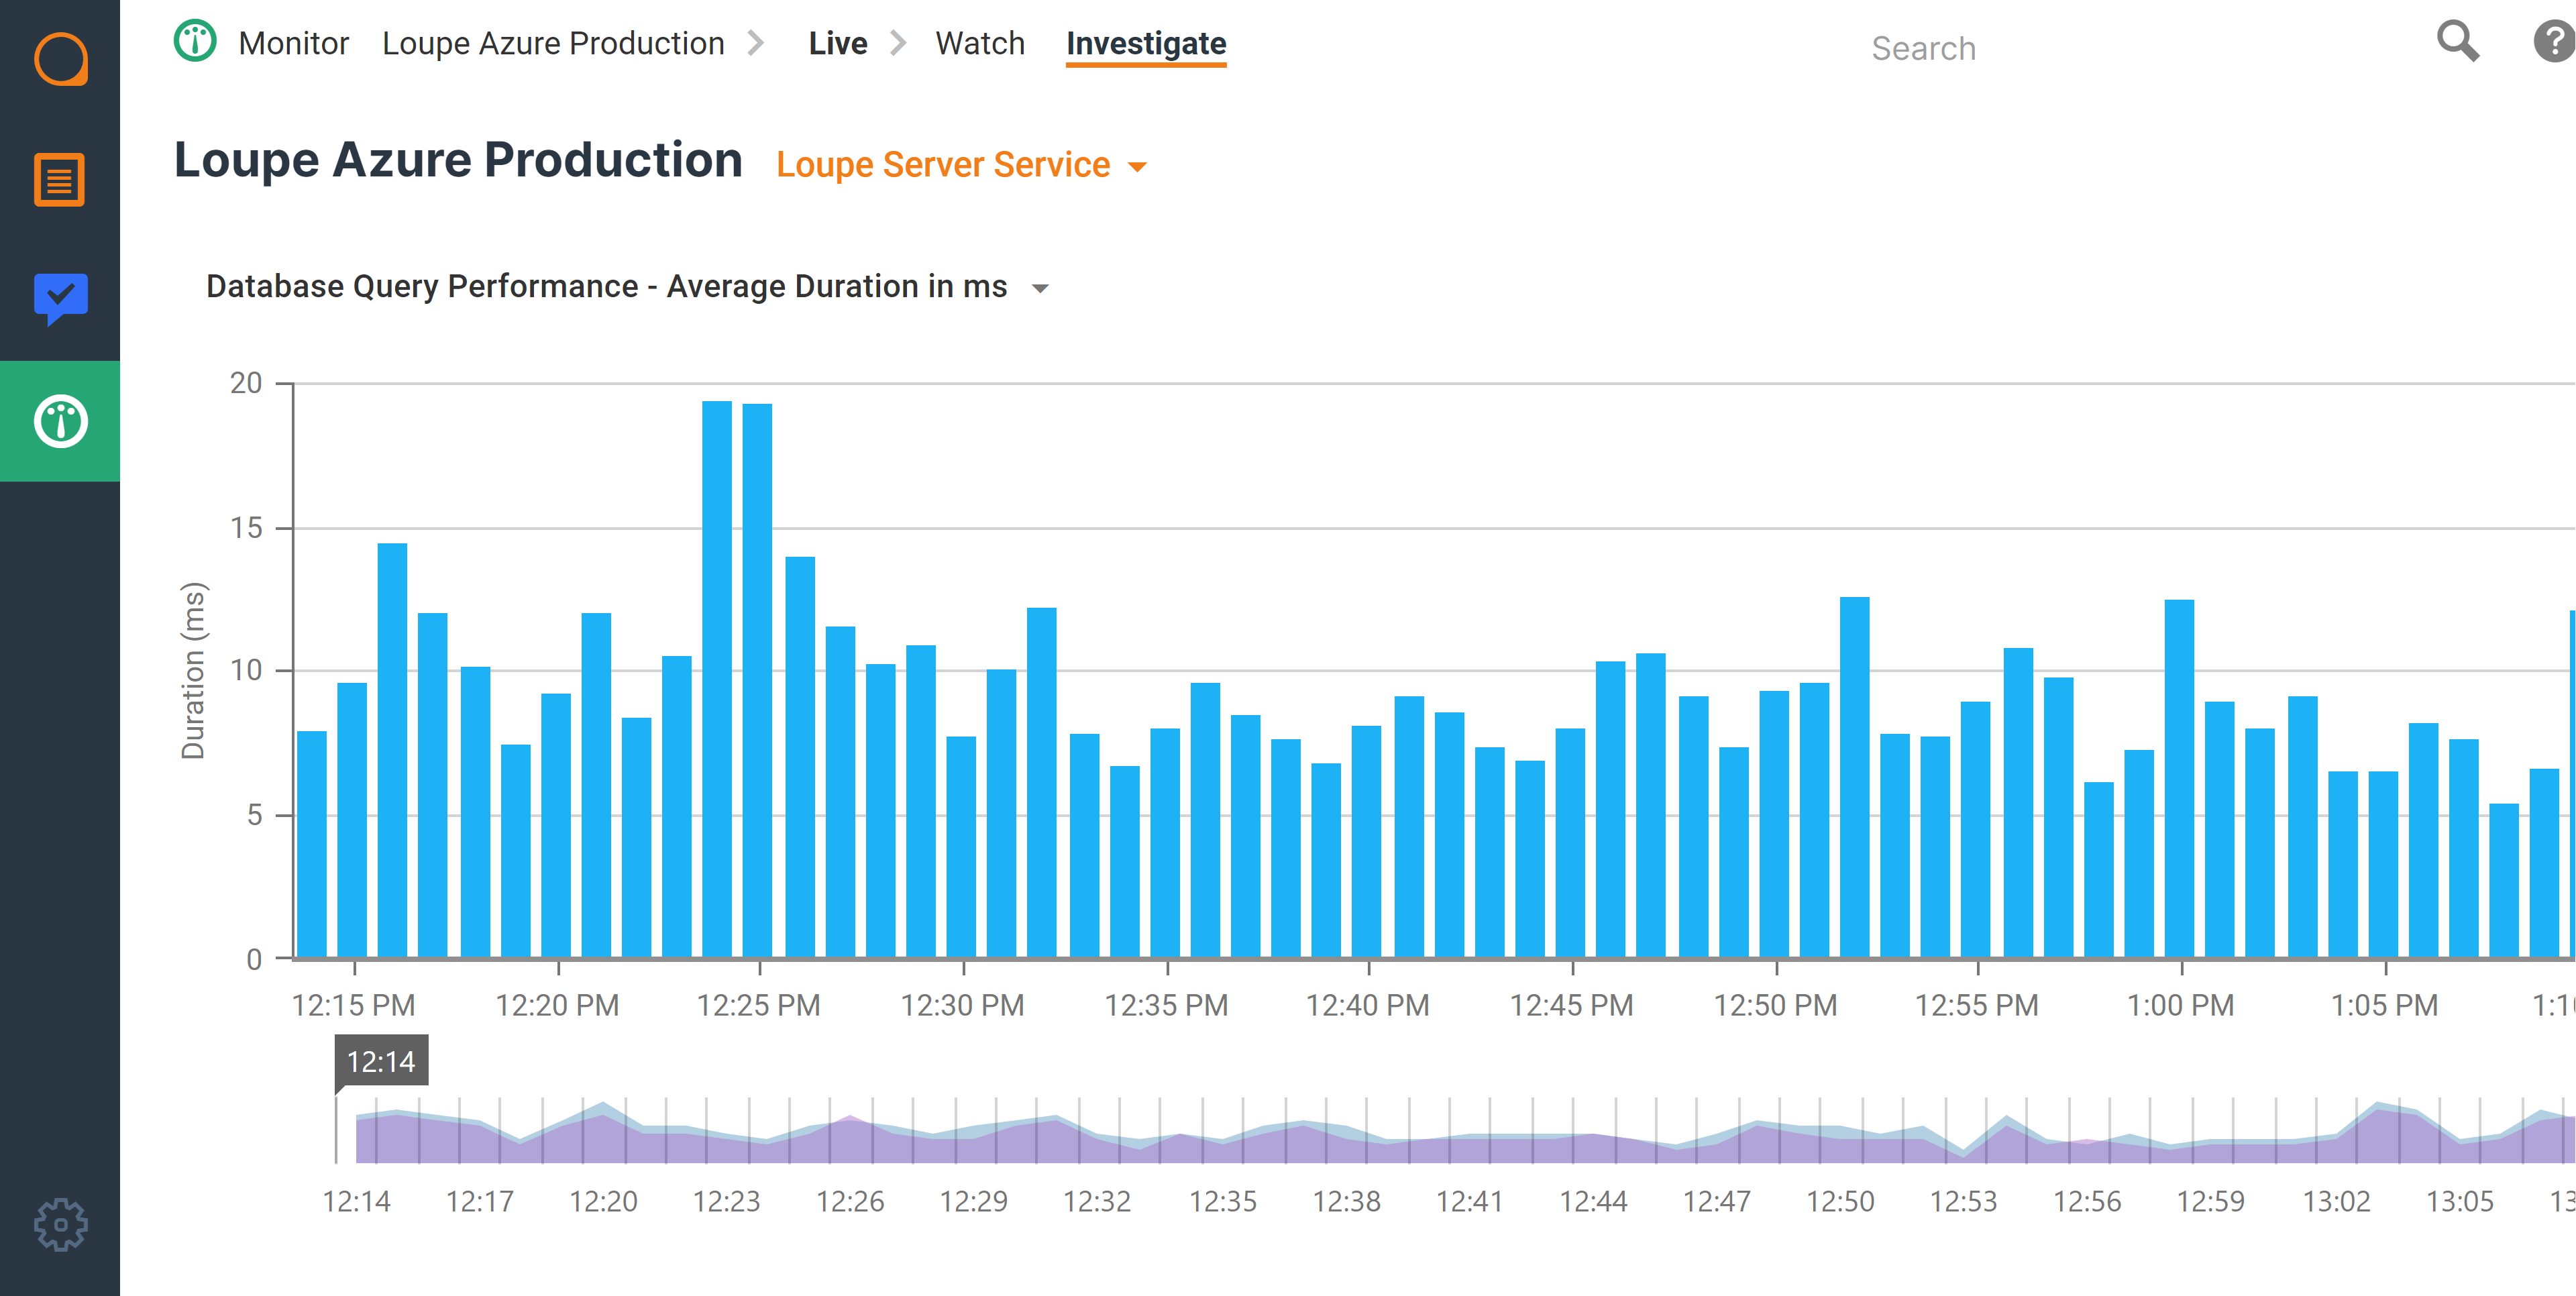
Often, the problems that arise in production are not the result of application defects, but circumstances. Things like hardware malfunctions, power fluctuations, and user counts can affect your applications' effectiveness. That's why Loupe Monitor helps you track items besides error rates, such as database query performance, private memory size, page hits, and more. Sometimes, these items can help indicate a problem better than errors alone, or provide additional context for a situation.
This way, when a group of errors does occur (like disconnections, etc.), you have extra data available to help you understand the severity of the issue, potential causes, and make quick decisions before the situation gets worse.


