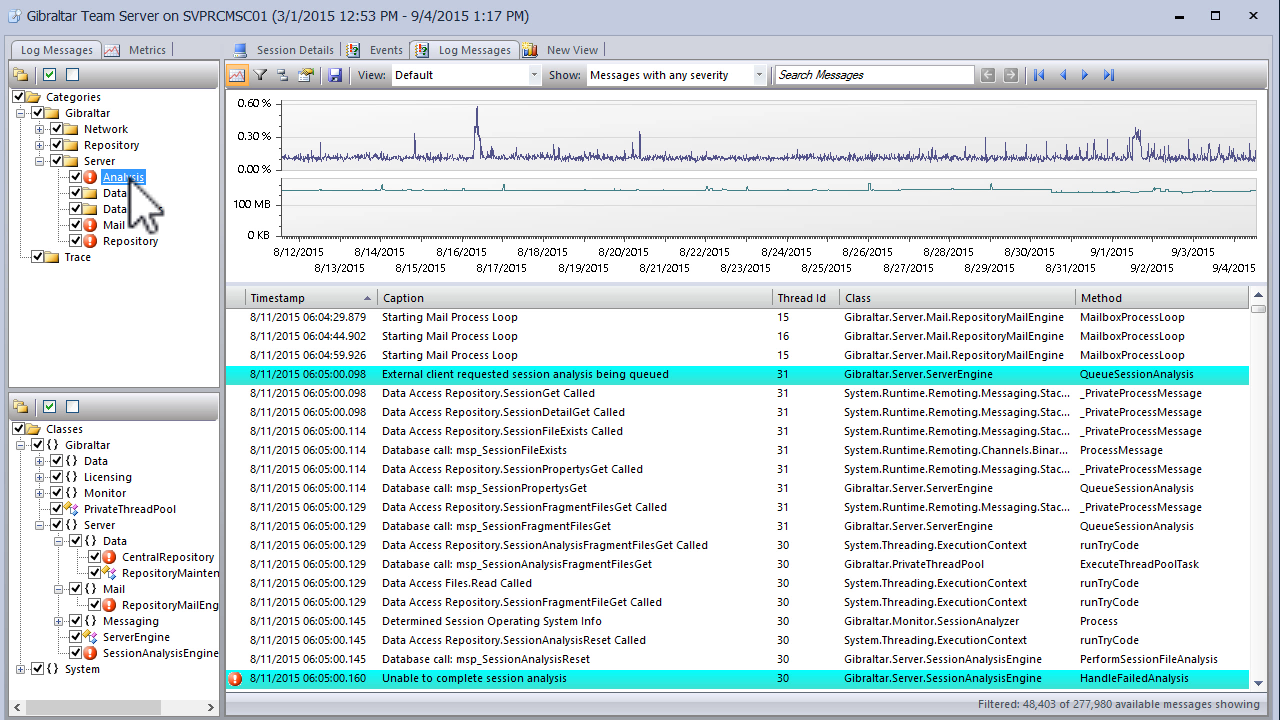
Get the whole story, not just the headlines
Loupe gives you complete visibility into application health. Starting from a dashboard displaying key metrics and events for your favorite application, you can drill-down into any event, session, machine or user. In particular, Loupe let's you see the full session log of trace events and performance metrics to understand the execution context preceding errors.
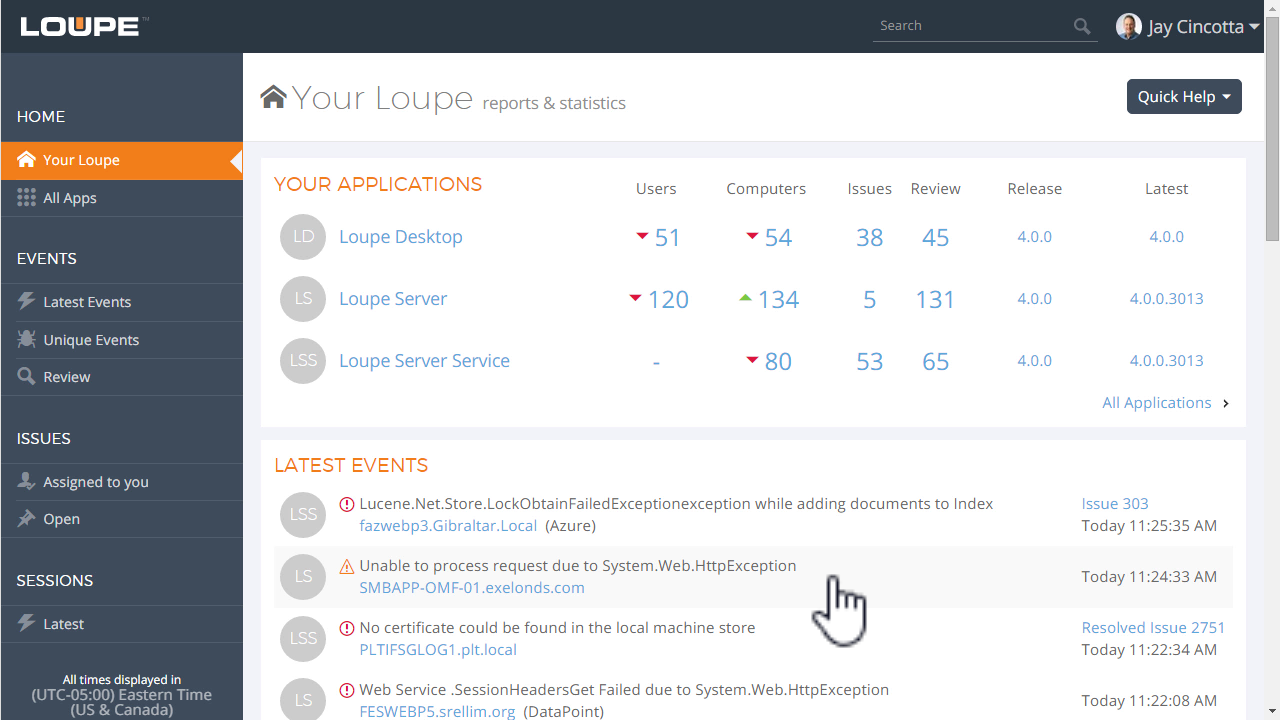
Dashboard
Provides an overview of metrics and events for your favorite applications
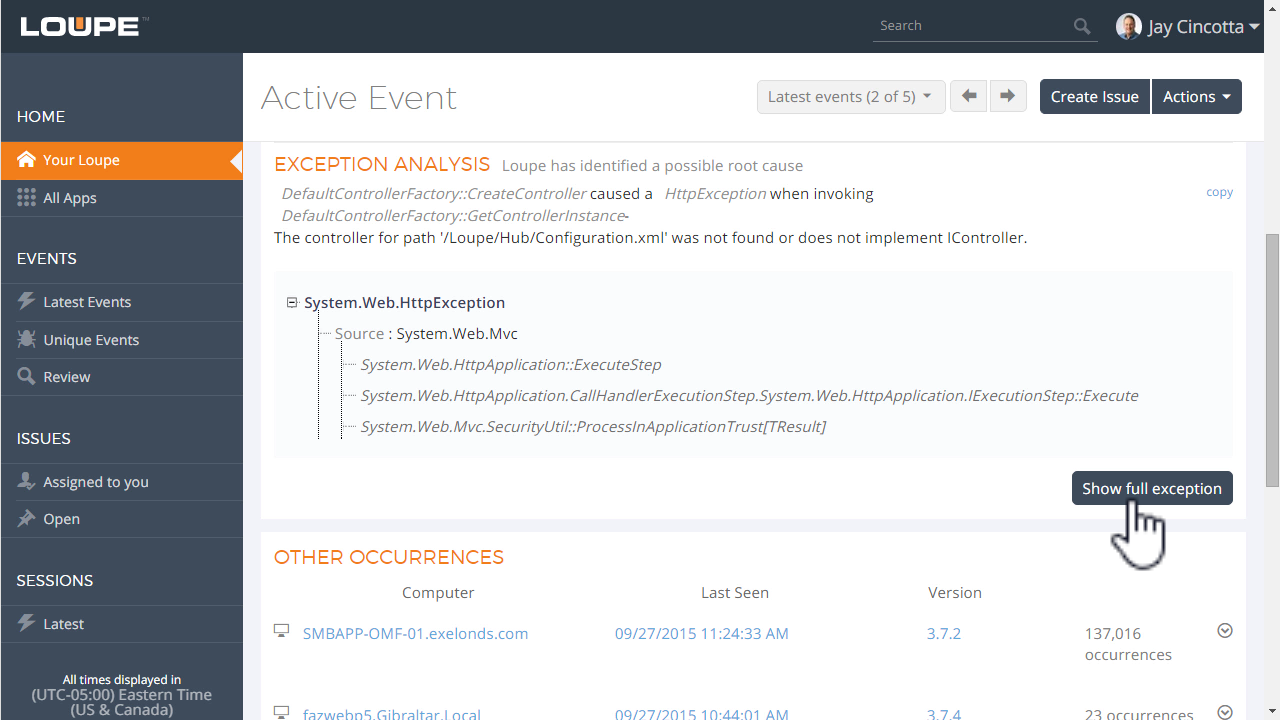
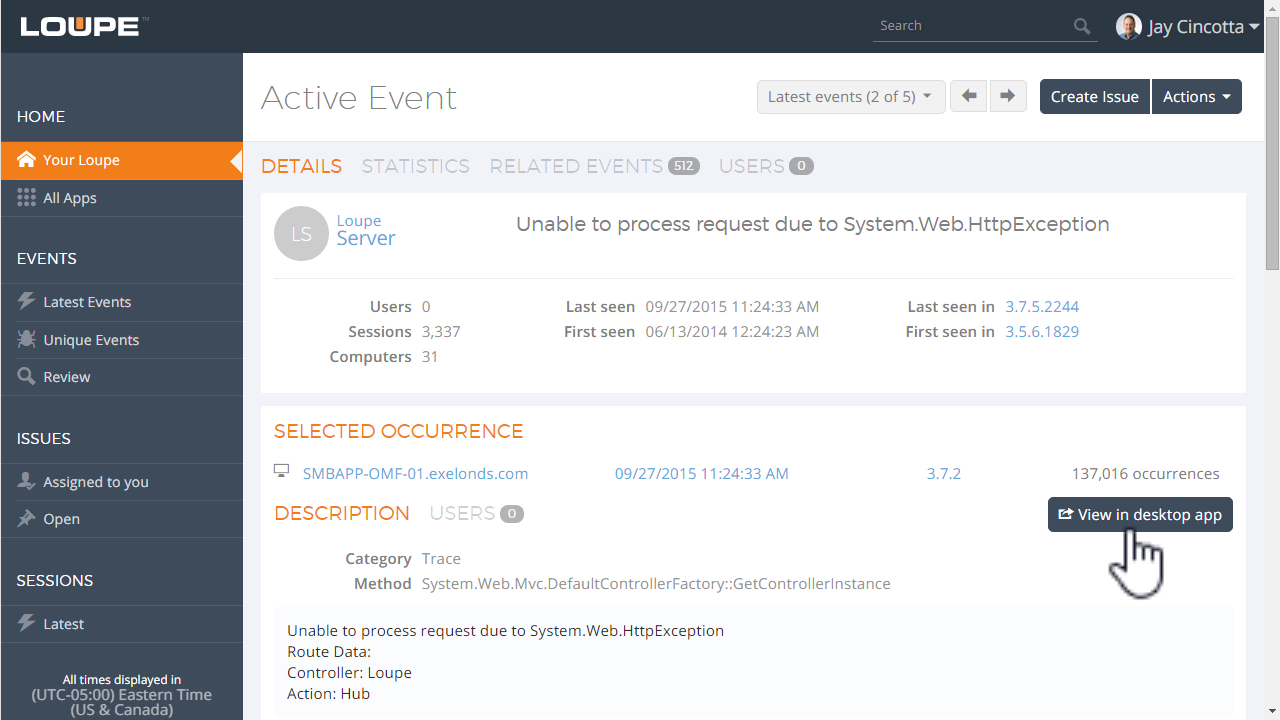
Exception analysis
The details on each error event include an exception analysis
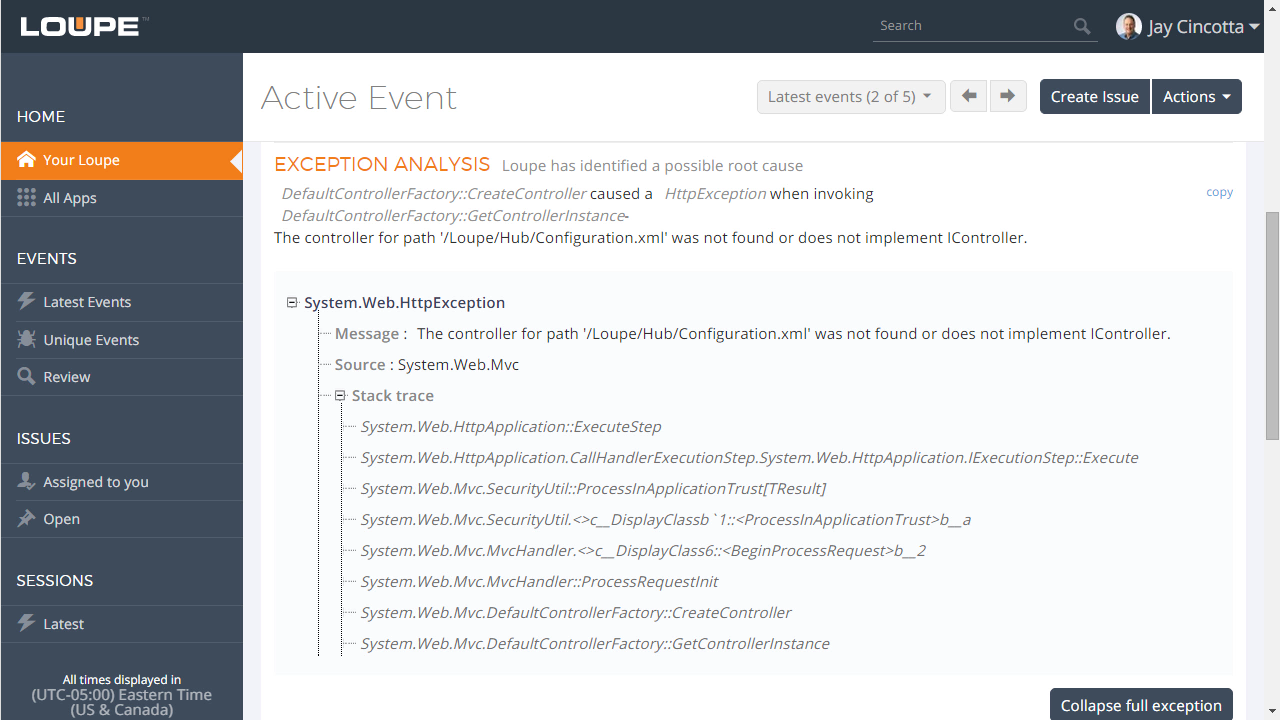
Full stack trace
Loupe provides access to the full stack trace on its exception analysis screen
Intelligent error grouping
Loupe intelligently groups all the occurrences of each error
Full trace log
Only Loupe lets you drill-down to the full trace log associated with each error
